Embedded Computing
  • About
  • Blog
  • Hardware
    • Which Platform?
    • Controller Platforms >
      • Adafruit Platform
      • Arduino Plaform
      • BBC micro:bit
      • Espressif Platform
      • iLabs Platform
      • Raspberry Pi Platform (MCU)
      • Seeed Platform
      • Silicon Labs Platform
      • Teensy Plaform
    • Computer Platforms >
      • BeagleBone Platform
      • Raspberry Pi Platform (SBC)
      • UDOO Platform
    • Peripherals >
      • Shields
      • Grove System
      • Sensors
      • Actuators
    • Displays >
      • E-Paper Displays
      • Reflective Displays
      • TFT Displays
      • LCD Displays
    • Legacy Platforms >
      • chipKIT Plaform
      • 4D Systems Platform
      • Intel Platform
      • LaunchPad Plaform
      • BoosterPacks for LaunchPads
      • LightBlue Bean
      • Maple Plaform
      • Mediatek Platform
      • Microsoft Azure IoT DevKit
      • Particle Platform
  • Software
    • Exploring RTOS with Galaxia >
      • Event Library
      • Semaphore Library
      • Mailbox Library
      • Timer Library
      • Clock Library
      • SWI Library
      • Task Library
    • Ultra-Low Power with EnergyTrace >
      • Ultra-Low Power with MSP430
      • Ultra-Low Power with Energia MT and Galaxia
    • Using Integers Instead of Reals
    • Going Python?
  • IoT
    • IoT Platforms: Which Hardware? >
      • Matter with Silicon Labs MG24
    • IoT Services: Which Solution? >
      • Recommended IoT Solutions
      • Platform-Specific IoT Solutions
      • Other IoT Solutions
      • Not tested IoT Solutions
      • Notification Solutions
    • Get Date and Time from Internet with NTP
    • Fast and Easy WiFi Connection with QR-Code
  • Tools
    • How to Start?
    • Reference >
      • Asking for Help
      • Boards Pins Maps
      • Ruler
      • Boards and Plugs
      • I²C Logic Level Converter
      • Standards for Connectors
    • Training >
      • Texas Instruments Workshops
      • Embedded Systems: Shape The World — MOOC edX UTAustinX UT.6.02x
      • Embedded Systems - Shape The World: Microcontroller Input/Output — MOOC edX UTAustinX UT.6.10x
      • Embedded Systems - Shape The World: Multi-Threaded Interfacing — MOOC edX UTAustinX UT.6.20x
      • Real-Time Bluetooth Networks: Shape the World — MOOC edX UTAustinX UT.RTBN.12.01x
      • Systems Thinking with Texas Instruments Robotics System Learning Kit
    • Books >
      • Getting Started with the MSP430 LaunchPad
      • Getting Started with Arduino
      • Arduino Cookbook
    • IDE >
      • The Battle of IDEs
      • More Options
      • Assessing the Next Generation of IDEs
      • Tools for Documentation
    • Equipment >
      • Saleae Logic Analyser
      • Rigol DS1102E Oscilloscope
      • XDS110 Debug Probe with EnergyTrace​
      • Segger J-Link Programmer-Debugger
      • Nordic Power Profiler Kit II
  • Projects
    • Libraries >
      • Master I²C Software Library
      • Date and Time Library
      • highView Library Suite
      • Others Libraries
    • smartDevices >
      • I²C smartColours Smart Sensor
      • I²C smartRFID Smart Sensor
      • I²C smartLED Display
      • I²C smartControls Smart Device
      • I²C smartWiFi Smart Device
      • I²C smartBLE Smart Device
      • I²C smartNode Smart Device
    • IoT Projects >
      • Remote E-Paper Weather and Message Board
      • Typie-Walkie with LoRa and E-Paper Screen
      • Typie-Walkie with E-Paper Screen
      • Remote e-Paper Pictures Panel
      • Remote e-Paper Messages Panel
      • Industrial IoT Project
      • Remote Contactless Temperature Monitor
      • Using Node-RED for IIoT
      • Low Power Home Network Weather Monitoring
      • Updated Low Power Home Network Weather Monitoring
      • Weather and Security Station with Blynk
      • SensorTag to Blynk Using Node-RED
      • Pervasive Reporting
    • AI Projects >
      • Colour Recognition with Neural Network
    • Other Projects >
      • Air Quality Monitoring
      • Driving a Large E-Paper Display with a Compact Xiao RP2040
      • Low-Power E-Paper Weather Station
      • Portable Particulate​ Matter Monitor
      • FRAM-based E-Paper Screen Controller
      • General Purpose 3.5" Screen
      • Colour Recognition with Neural Network
      • A Low Power Weather Station
      • Digital Volt-Amp-Watt Meter
      • Mobile Measurement with LCD Display
      • Screen with SRAM for GUI
      • Volt-Amp-Watt-Meter for Grove
      • Multi-Touch Project with CapTIvate

Pervasive Reporting

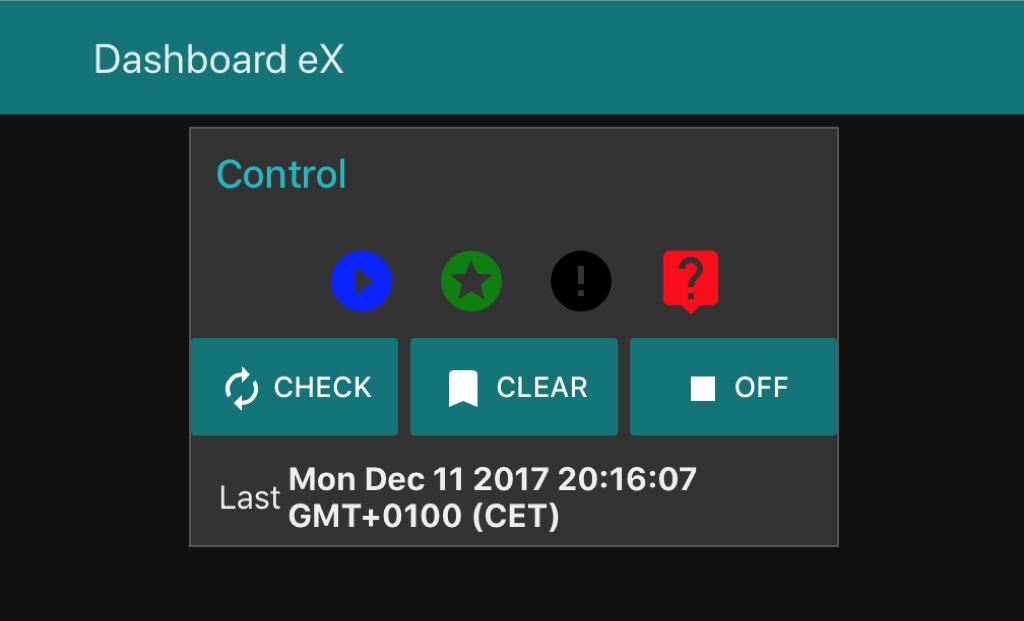
This project was prompted by the management of embedXcode. Is the website up and running? Do downloads perform smoothly? Are there tickets to answer?

How to deal in a timely manner to all those events? Up to now, I had to turn a computer on, log in and check manually different sites to check each possible event. Very time consuming. 

​So the idea is to have the information always available, and to check it visually.
Picture

General 

Because each metric is provided by a different supplier, the first step is to gather the information from all the relevant websites. 

Some websites provide an API to get the information, others don't. For example, the request for getting the number of open tickets is listed on the right, based on the Freshdesk API.

​Converting a URL request into a POST request isn't always easy, especially when authorisation is required.

Instead of interrogating each external supplier, a page on my website gathers all the information and provides a unique compact JSON string with all the answers.


Micro-Controller

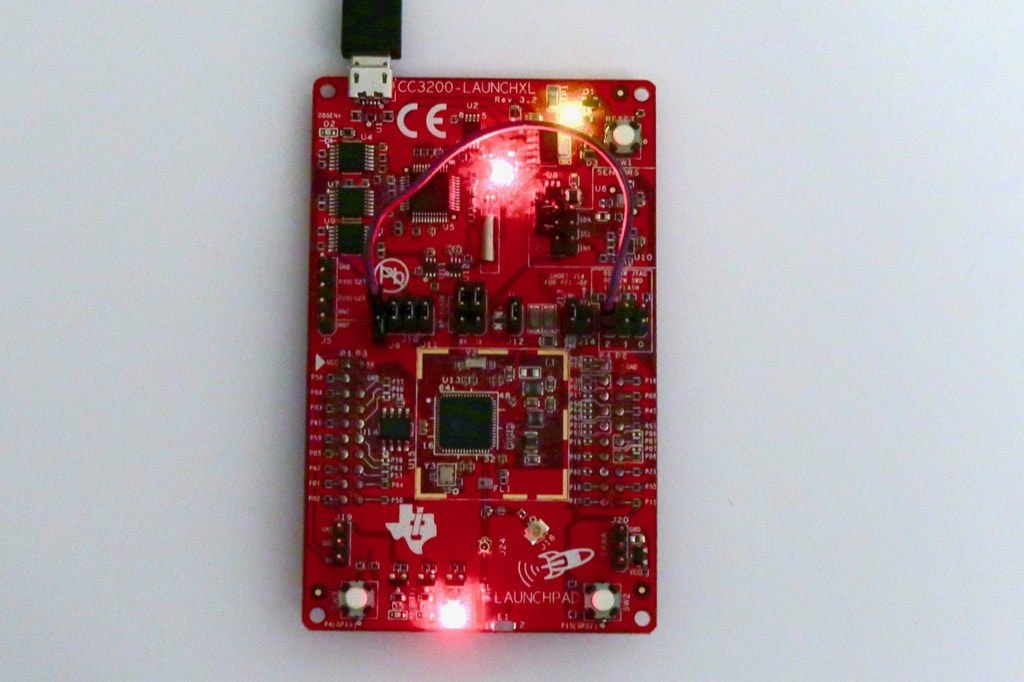
The micro-controller connects to the dedicated page and retrieve the JSON string with all the metrics. For simplicity, I'm using WiFi with the CC3200 LaunchPad. 

LEDs are turned on and off accordingly. For example, yellow reports an download error, red an open ticket (as shown on the right).

I like this qualitative approach. Total cost of this solution is USD 30 for the CC3200 LaunchPad. 
Picture
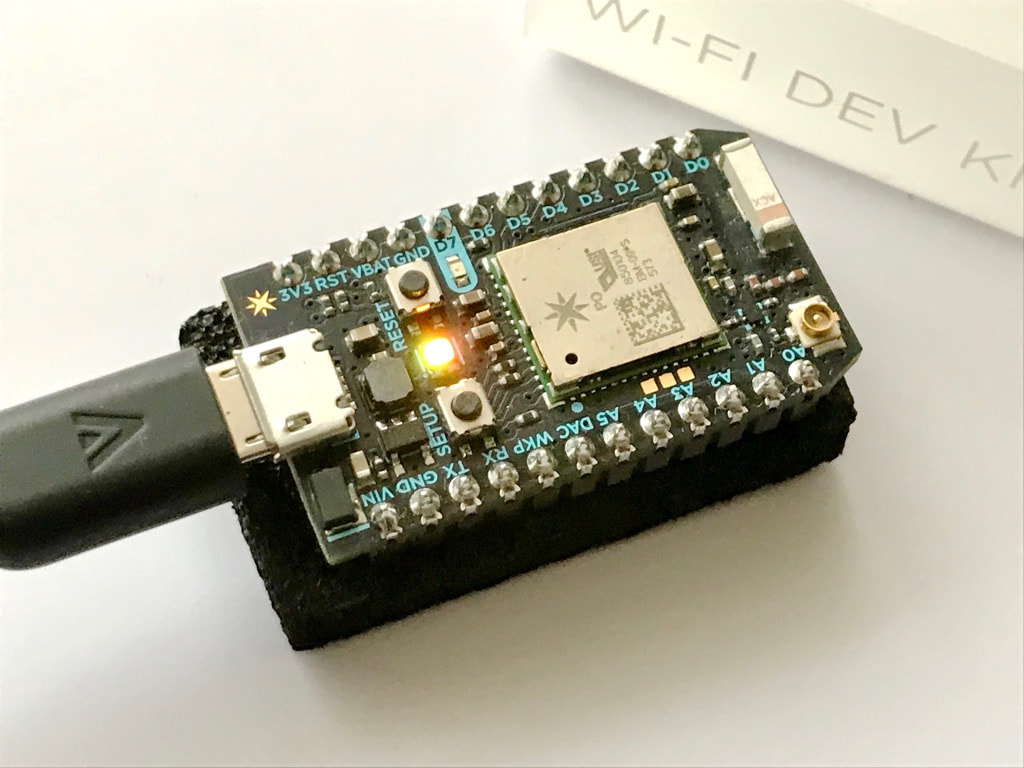
For a more compact form-factor and minimalistic design, I tried the Particle Photon with one single RGB LED.

The single RGB LED displays the colour of the most important item, for example red goes over yellow for ticket being more important than download error.

This solution is even easier to carry with a total cost of USD19, despite the lack of a valid off-line IDE.

Picture
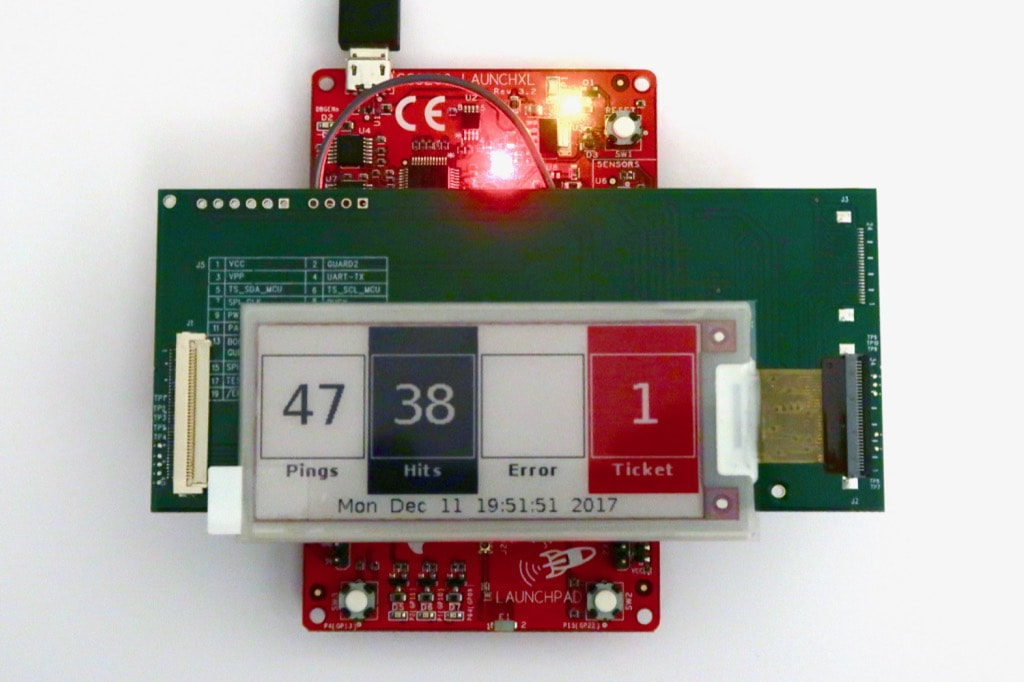
For a more quantitate approach, I'm using a e-paper screen to display the different metrics.

I'm leveraging the three-colour e-paper display from Pervasive Displays to display errors and tickets white-on-red for better readability. 

Sure, WiFi isn't the best technology for a low-power solution, but BLE or sub-1 GHz would require a local hub to get the data from. The CC3200 LaunchPad includes 256 kB of SRAM, making the perfect solution for hosting the frame buffers required by large e-paper screens. 

The e-Paper Pervasive Display BoosterPack and screen should be added to the CC3200 LaunchPad mentioned in the previous solution. 
Picture

Nano-Computer

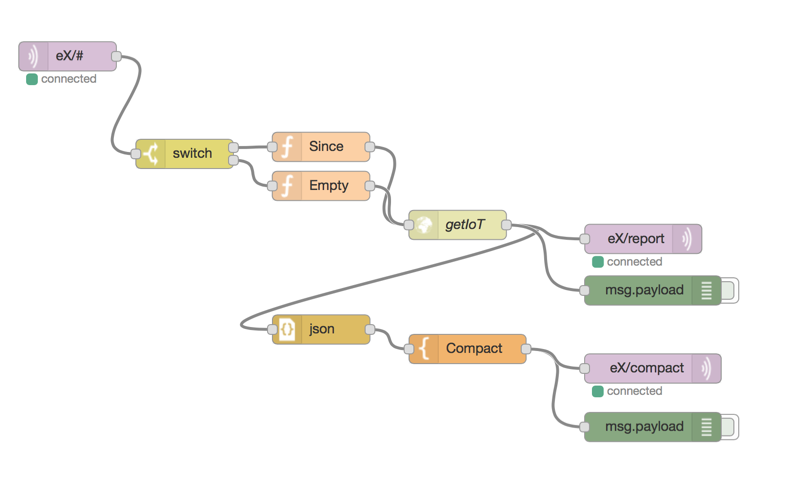
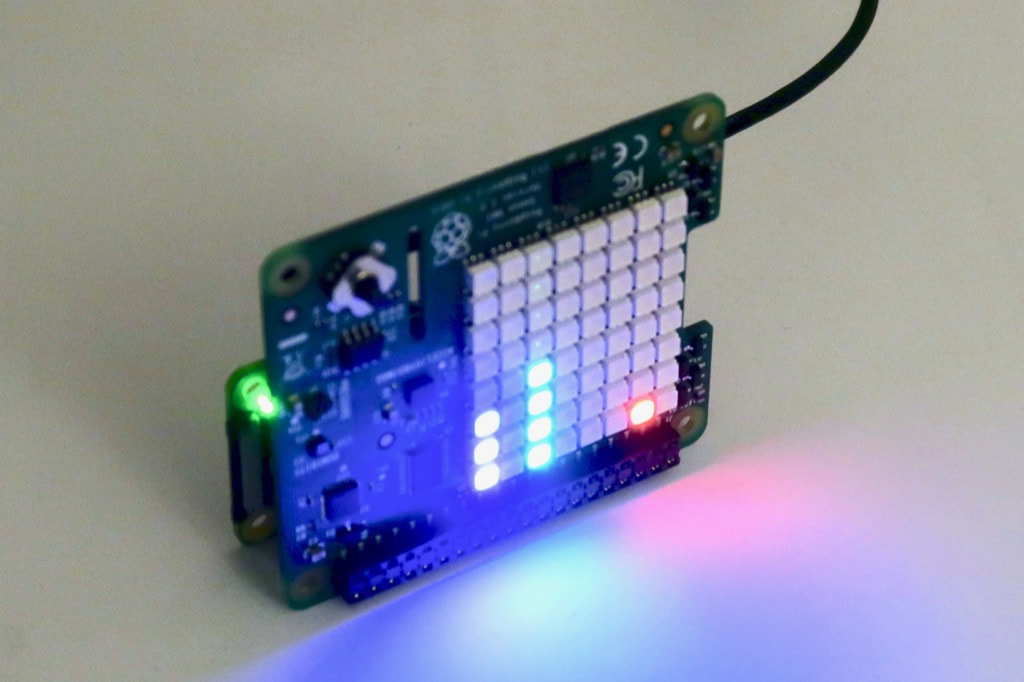
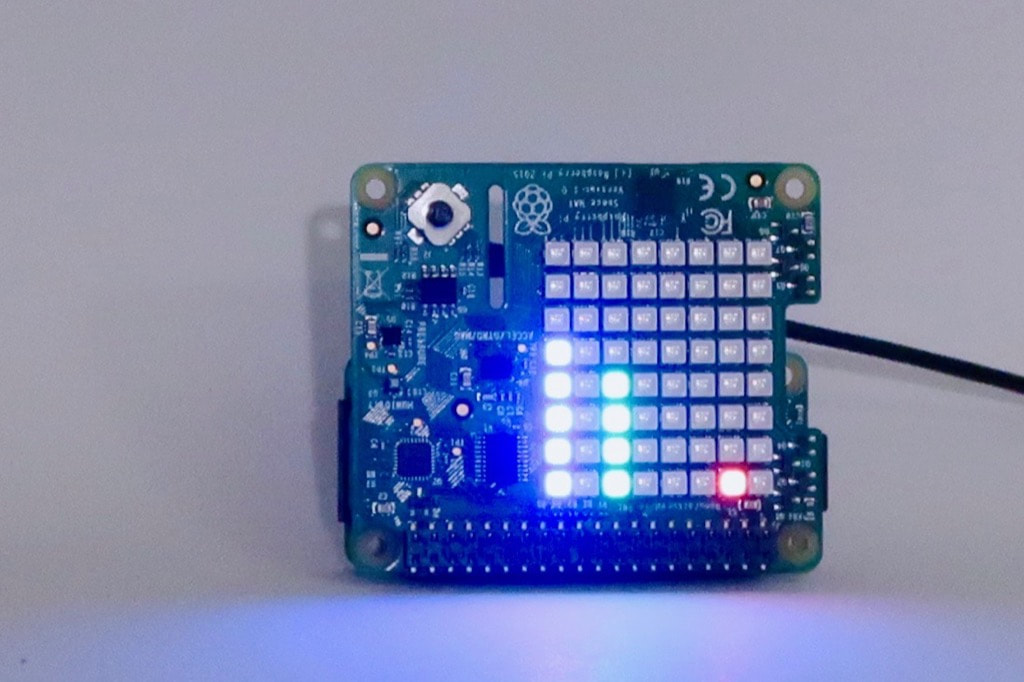
If a local hub is needed to gather the metrics from Internet and dispatch them locally through BLE or sub-1 GHz, why not to display the data right right on the hub?

​The Raspberry Pi Zero Wireless is compact, very affordable and expandable with hats. The Sense Hat features a 8x8 RGB LED matrix.

Even better, all the code for retrieving and displaying the metrics is carried out using Node-RED. The project contains three flows:
  • The first flow (shown right) sends the HTTP requests and gathers the responses.
  • A second flow displays the responses on a dashboard (shown on the top of the page).
  • A third flow displays the response on the 8x8 RGB LED matrix (shown below).
​​
Picture
The higher the values, the higher and thus the brighter the bars on the 8x8 RGB LED matrix. This is a nice balance between the two previous approaches, quantitative and qualitative.

Total cost of this solution is USD 45, with Raspberry Pi Zero Wireless at USD 10 and Sense Hat at USD 30. Hats with 8 RGB LEDs are available at a fraction of that cost.
Picture

Conclusion

As always, there are many solutions instead of a single one, and each one comes with its pros and cons.

Now, I no longer need to power my computer on and check those metrics manually. All the answers are there, ready right under my eyes.
Picture
Powered by Create your own unique website with customizable templates.