XDS110 Debug Probe with EnergyTrace
|
Although all the LaunchPad boards from Texas Instruments come with a programmer emulator, not all feature EnergyTrace to measure power consumption. That is the case with the CC1310 LaunchPad I used on my Low Power Home Network Weather Monitoring project.
The XDS110 JTAG Debug Probe (TMDSEMU110-U) is an external programmer emulator with EnergyTrace. It can be extended with the XDS110 EnergyTrace™ High Dynamic Range (ETHDR) Debug Probe Add-On (TMDSEMU110-ETH) to perform more accurate measures on the power consumption. The hardware was sampled by Texas Instruments. |
|
Hardware
|
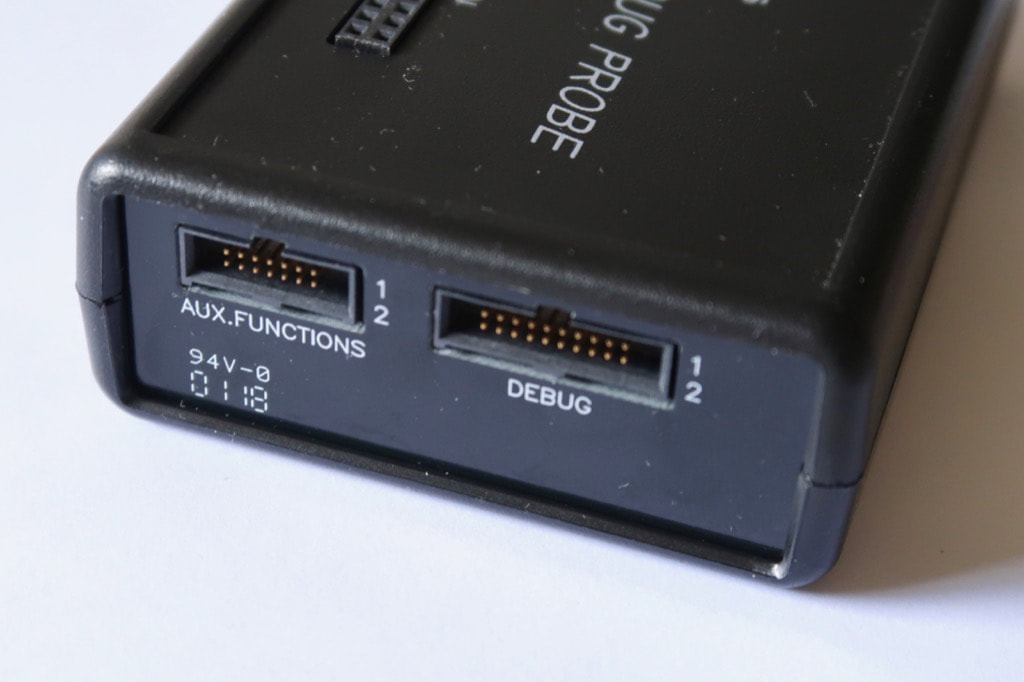
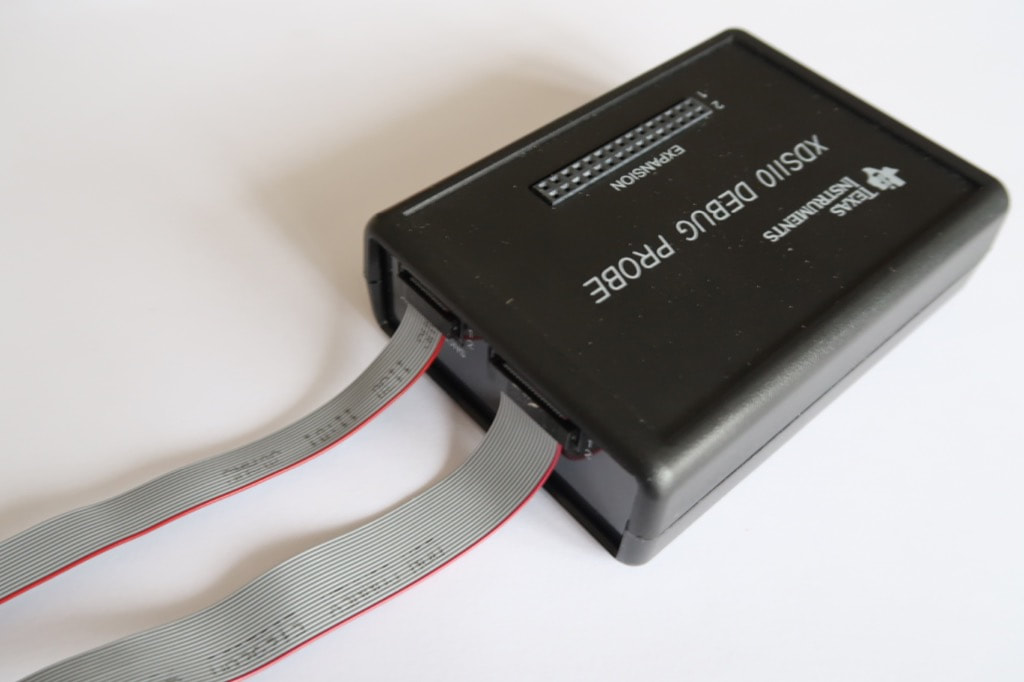
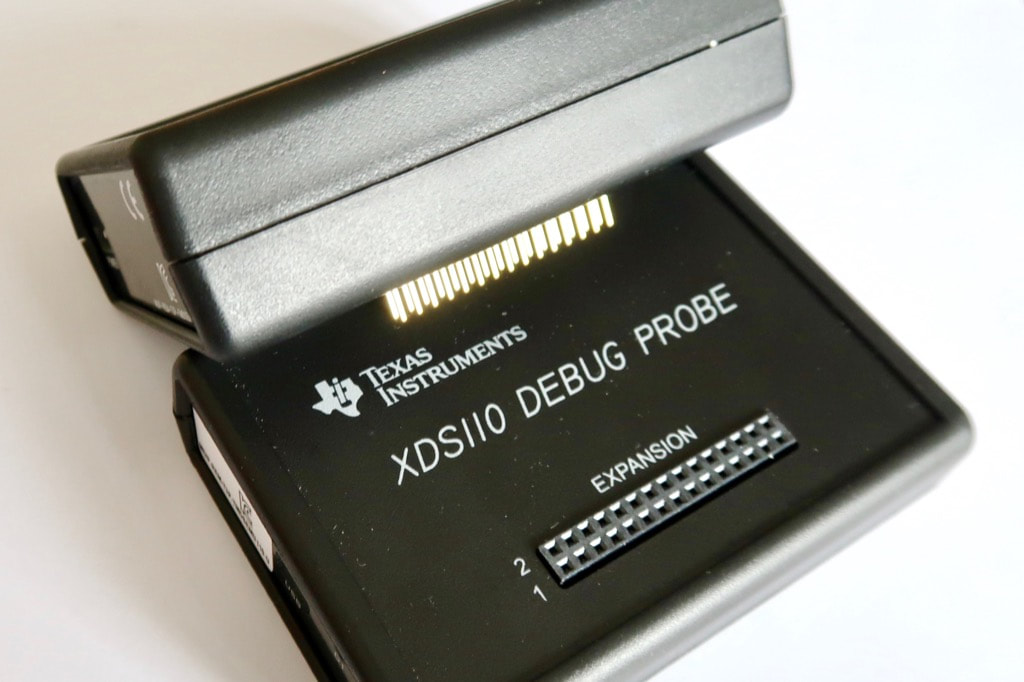
The XDS110 JTAG Debug Probe (TMDSEMU110-U) provides two ports: the main for debugging, the auxiliary for additional features like serial and EnergyTrace.
It connects to the laptop through a micro-USB and features two LEDs, although barely visible. The box includes 2 cables and 4 adaptors. |
|
|
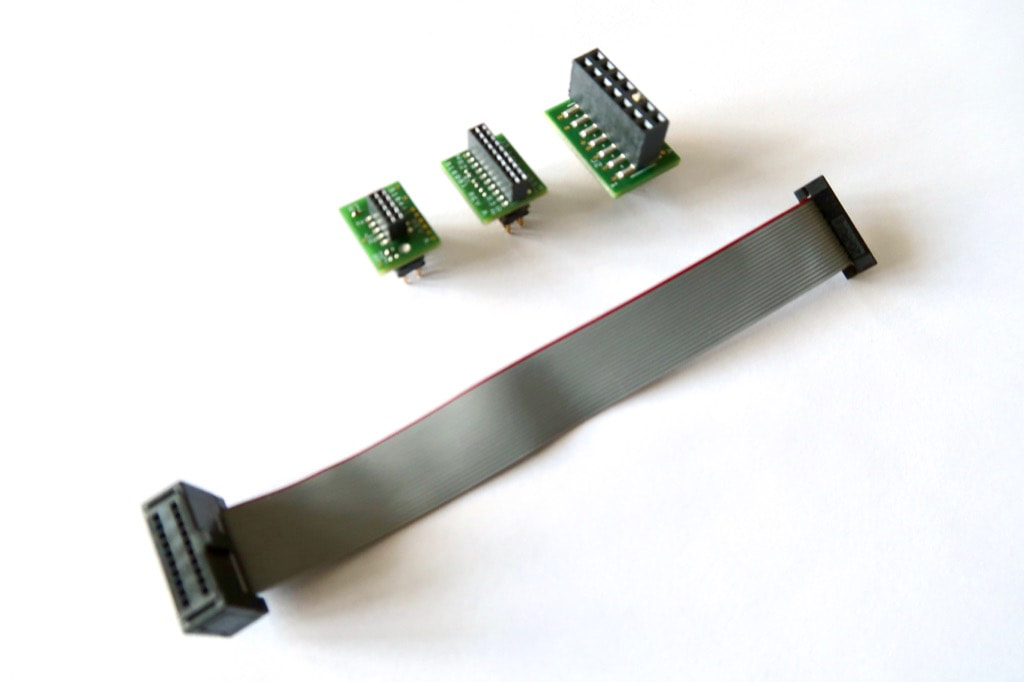
The main cable connects to the 2x10 debugging port and comes with three adaptors.
|
|
|
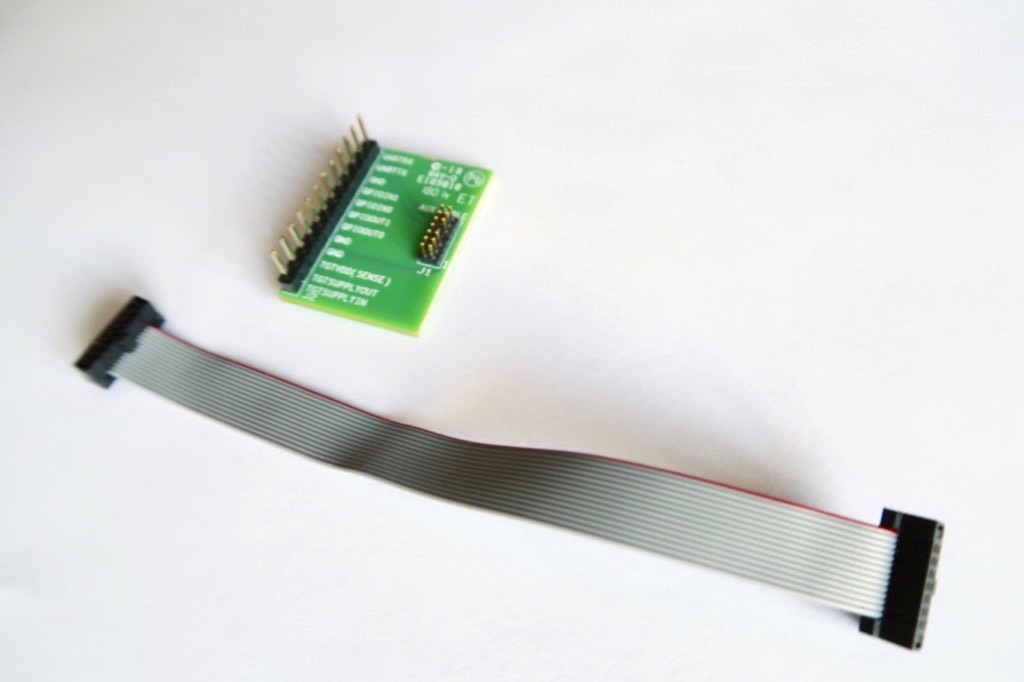
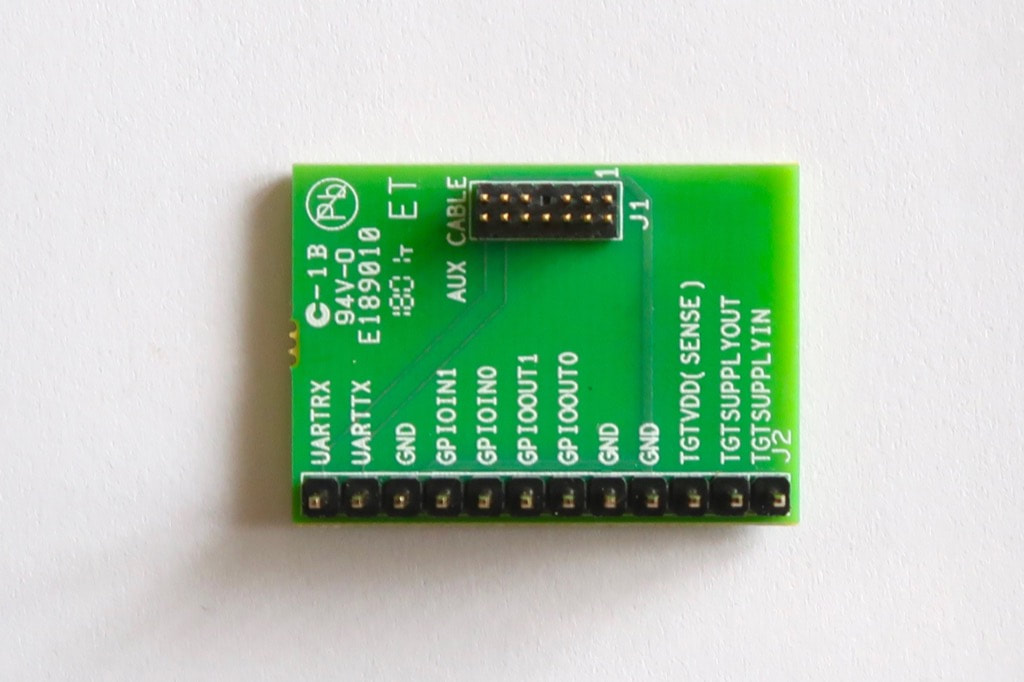
The auxiliary cable connects to the 2x7 auxiliary port and has a single adaptor.
The 1x10 0.1" board exposes the serial port, some GPIO inputs and outputs, and the supply pins for EnergyTrace. |
|
|
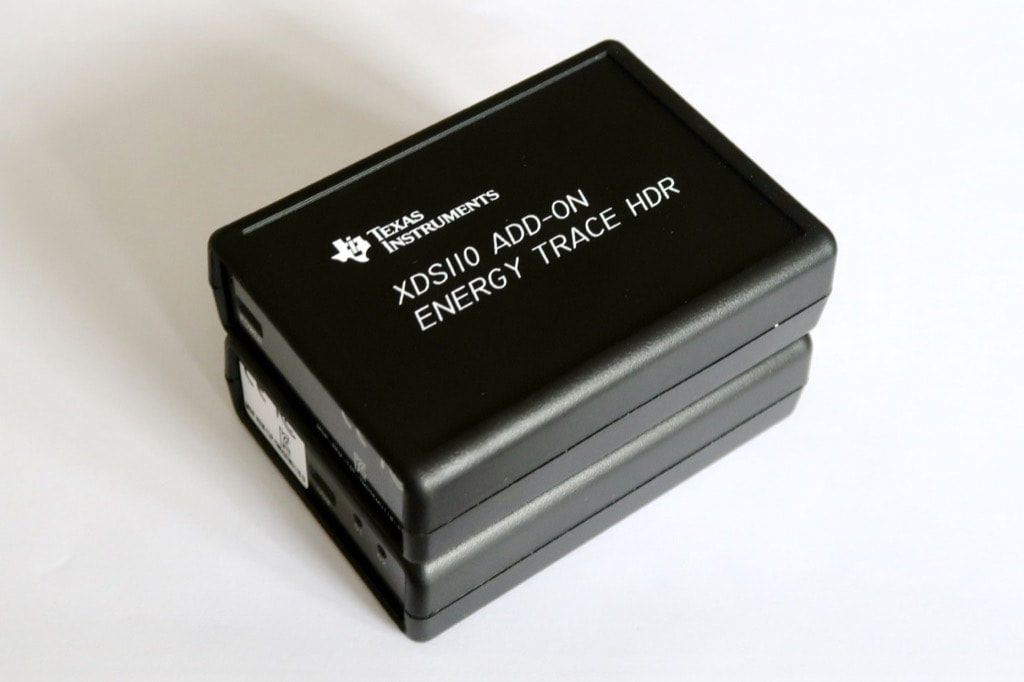
The XDS110 EnergyTrace™ High Dynamic Range (ETHDR) Debug Probe Add-On (TMDSEMU110-ETH) connects on the expansion port on top of the XDS110 and provides higher accuracy with increased range and faster sample rate.
|
|
The range is selected by software between 1 μA to 120 mA and 1 μA to 800 mA. However, sampling rate is not. Faster sampling rate implies a limited time window. Recommended time window for sampling is 10 s, so I used the TMDSEMU110-U alone as the protocol runs for 10 mn. |
|
Connecting to the Board
|
I've tested the XDS110 Debug Probe with EnergyTrace with the following boards:
On the CC1310 LaunchPad, connection wasn't the easiest one, as the 2x10 to 2x5 SWD adaptor features no fool-proof connector and no indication for pin 1, contrary to the other supplied adaptors. On the Launchpad SensorTag Kit CC1352R, room is really limited, preventing from adding any BoosterPack on top of the LaunchPad. |
|
|
So I had no choice but to build my own adapter for the Launchpad SensorTag Kit CC1352R with two 2x5 SWD connectors.
|
|
|
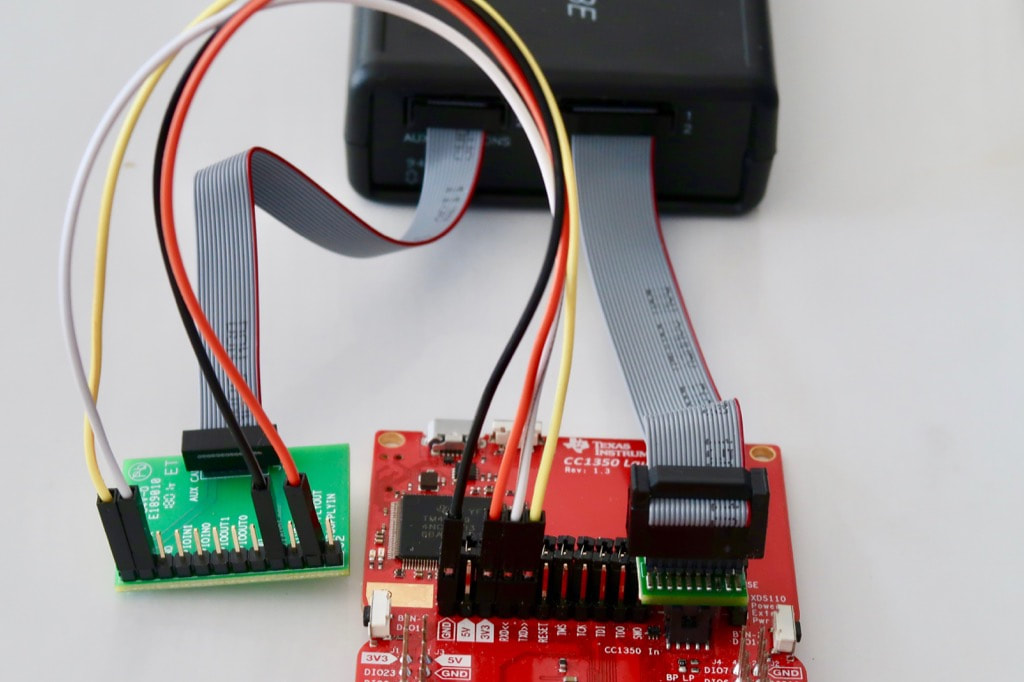
Additional features like power for EnergyTrace and serial are provided by with another 2x7 to 1x12 adaptor.
Each of 12 are spaced by 0.1" and clearly labeled. However, the LEDs are hard to read, as they are on the other side close to the USB port. |
|
|
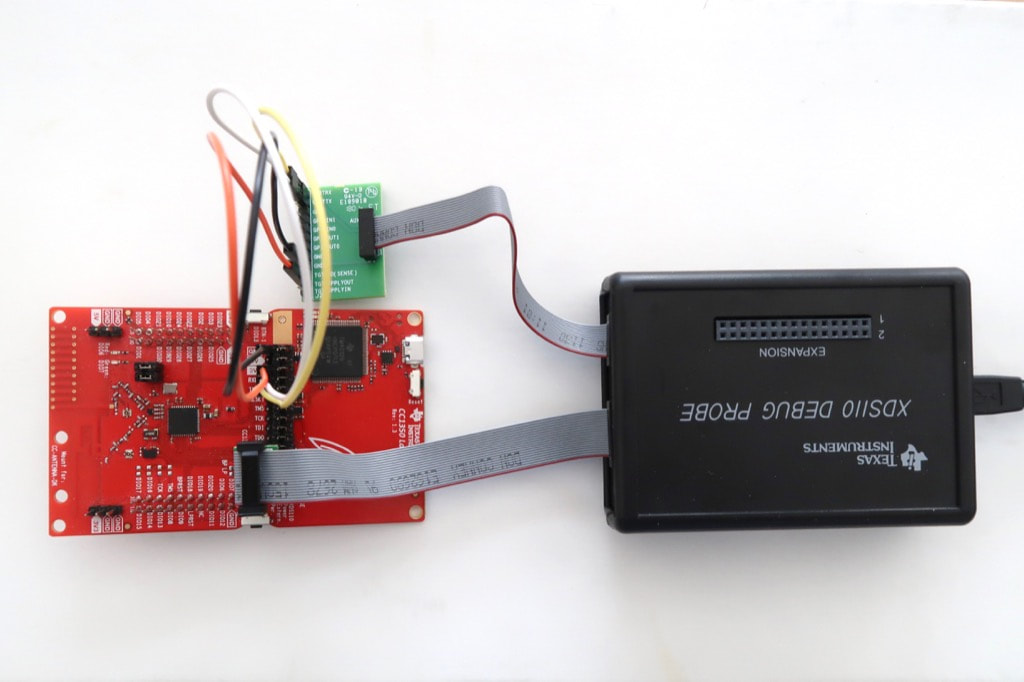
For the states and peripherals of the MCUs or EnergyTrace++, we need all the connections (pictured).
For power consumption alone, the connector on the right should be removed. |
|
Software
|
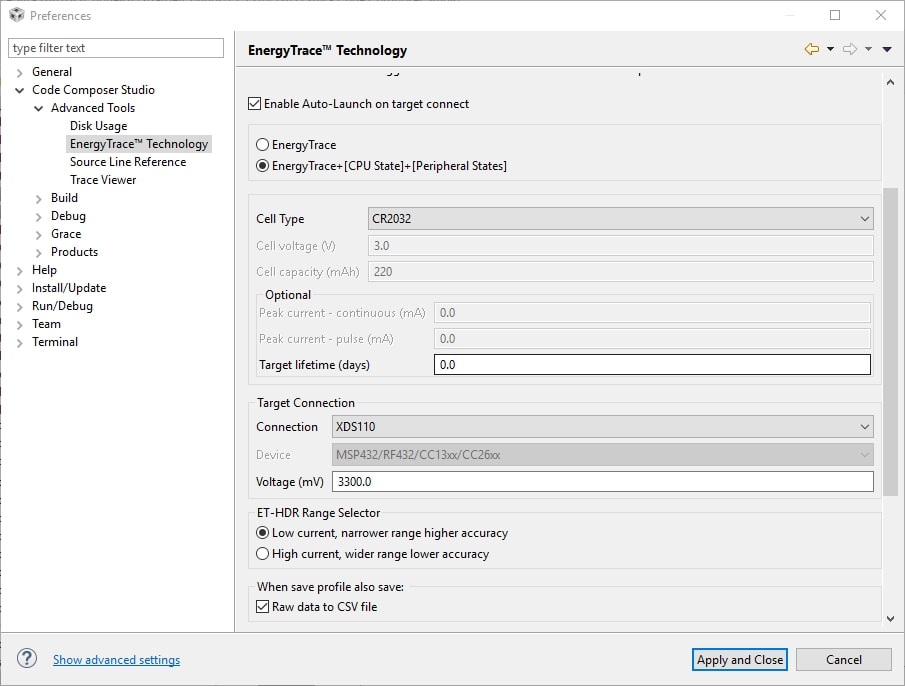
The official IDE Code Composer Studio includes EnergyTrace, with parameters, acquisition and graphs
Call the menu Windows > Preferences and go to the EnergyTrace page.
|
|
|
Double click on the .ccxml file of the project to edit the properties.
|
|
|
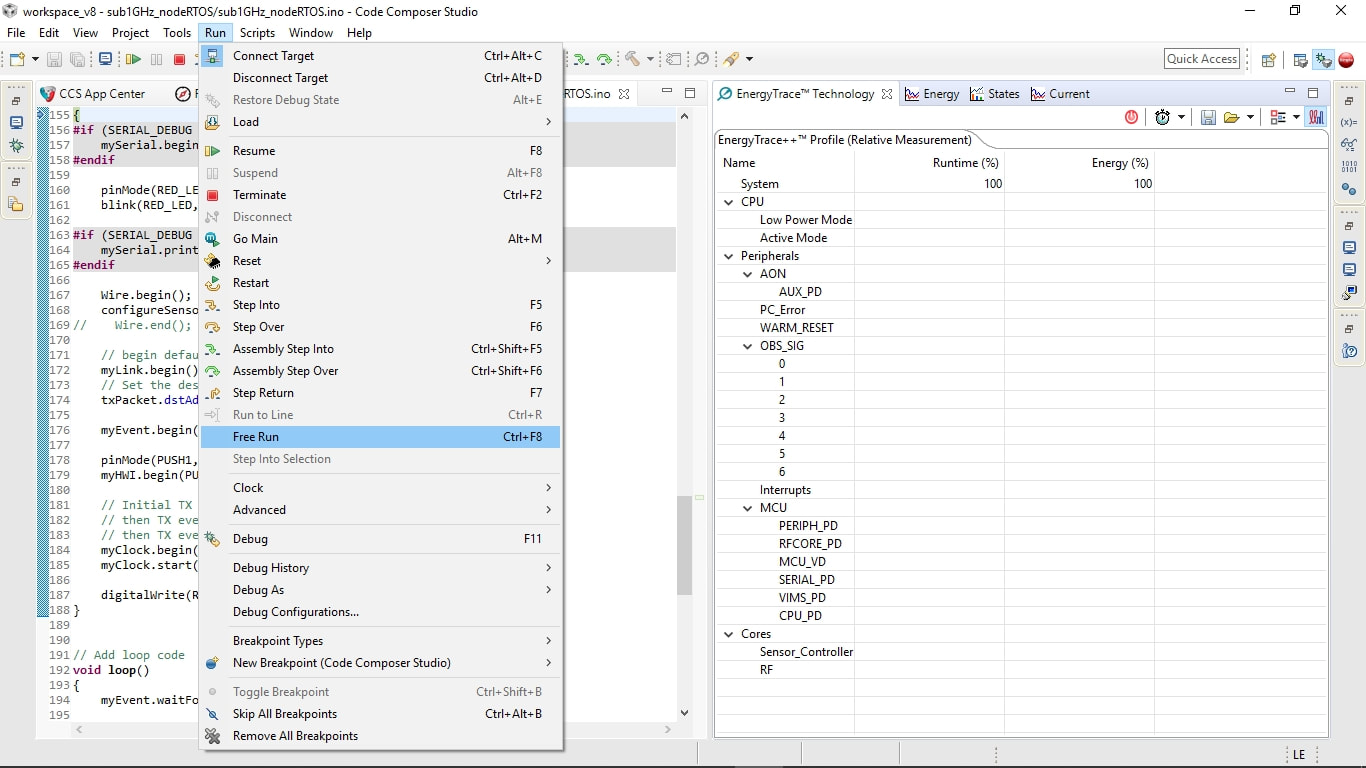
Ensure to use the Run > Run Free command to ignore the breakpoints, as debugging increases power consumption.
|
|
EnergyTrace
|
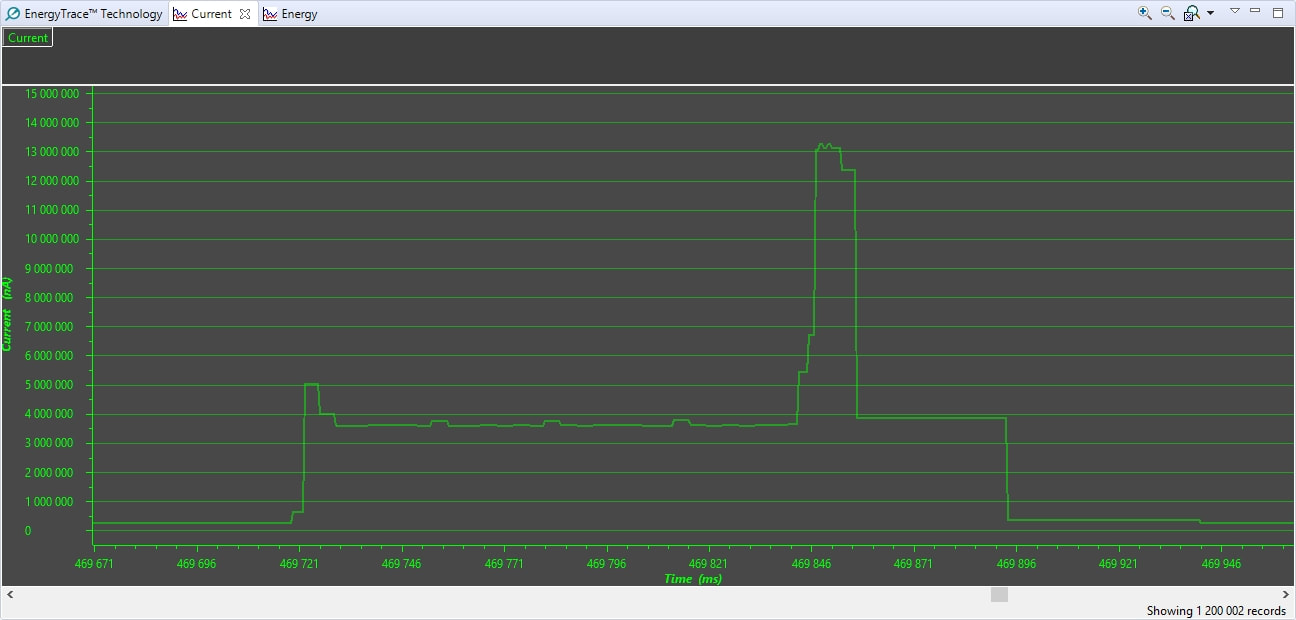
The Current graph is in green and displays power in nA. Here is the trace for the short active period of acquisition and transmission.
|
|
|
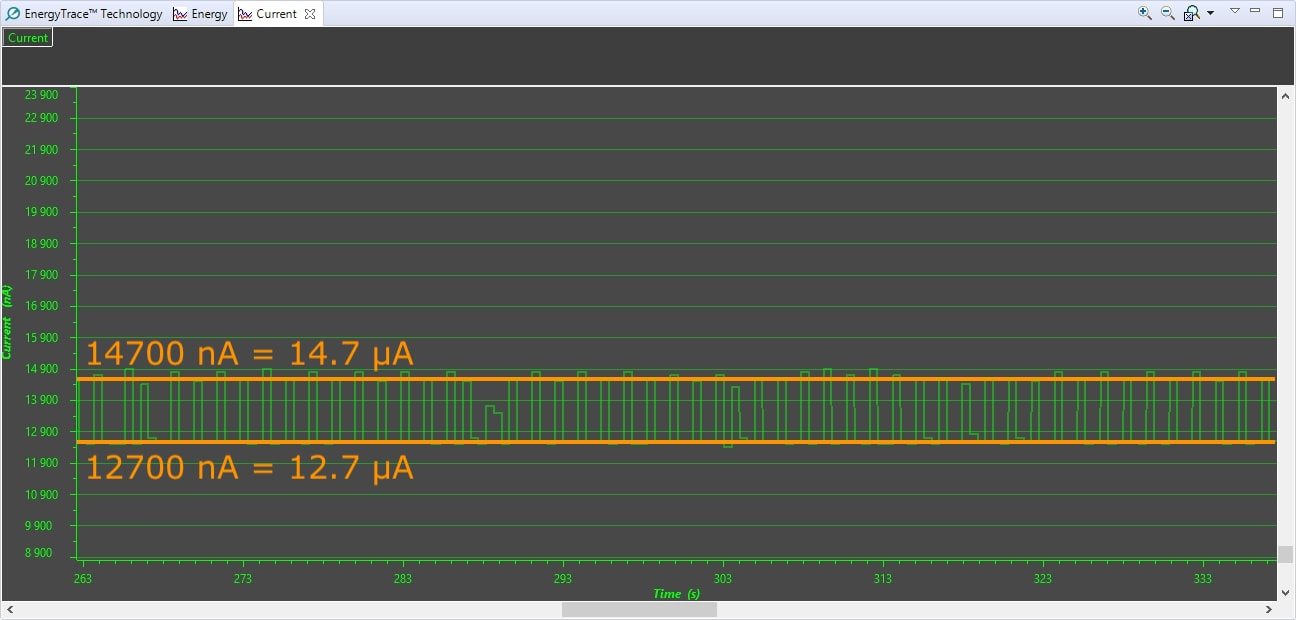
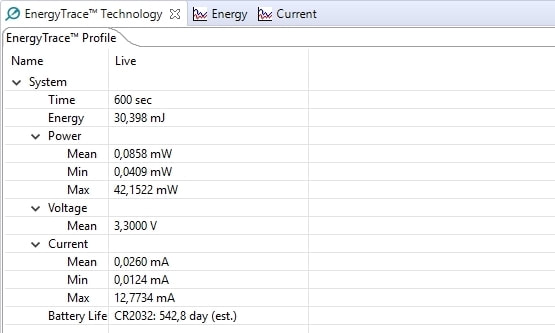
When in deep sleep, power consumption averages 13700 nA or 13.7 μA only.
|
|
|
The summary provides different metrics. an interesting one is the estimated battery life.
This sets a new record of 542 days for a CR2032 coin cell battery, almost 1 ½ years for the nodes of the project Low Power Home Network Weather Monitoring. |
|
EnergyTrace++
|
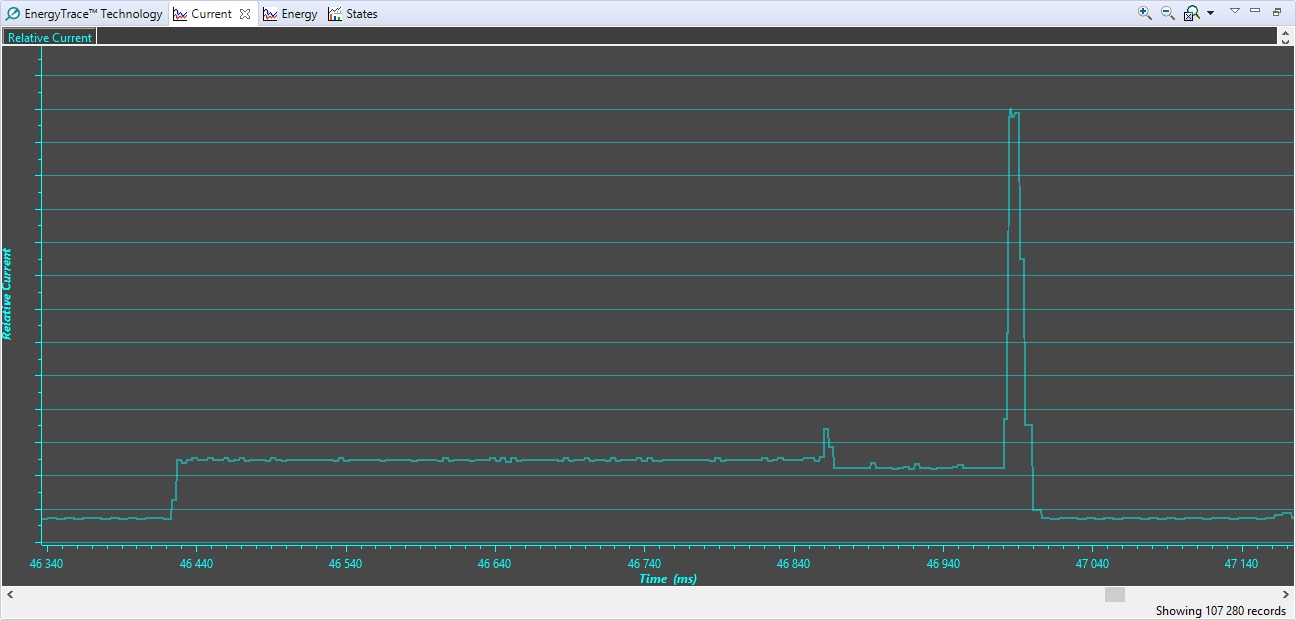
The Current graph is in pale blue and no longer displays power units, but relative current.
But the interesting part of EnergyTrace++ relies on monitoring the states and peripherals of the 3 cores of the CC1310. |
|
|
The States graph shows the states and peripherals of the 3 cores of the CC1310: main MCU labeled CPU, RF for radio and Sensor Controller.
The main MCU awakes from deep sleep and turns active, while radio transitions from synthesiser active to transmit. Blue lines shows the active peripherals. |

|
|
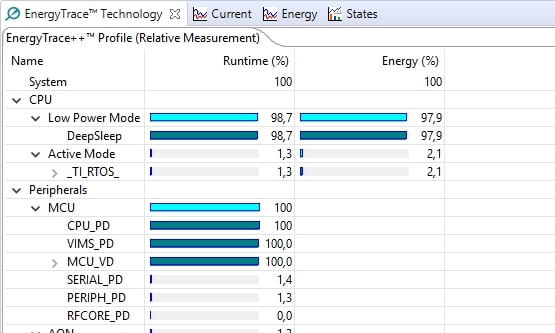
The summary provides a large assortment of statistics for both runtime and energy.
Here, low power mode deep sleep represents 98,7% of runtime but 97,9% of energy. |
|
Command-Line Alternative
|
Using EnergyTrace from within Code Composer Studio throws random errors like "Bad energy trace data was detected in trace stream". This is due to the fact EnergyTrace requires a significant share of resources.
It appears the USB XDS110 debug probe is more stable than the built-in programmer-debugger. Similarly, the command line utility stune for Windows requires fewer resources. It outputs a comma-separated-file that can be processed with Excel. |
|
Current and Energy Measures Consistency
|
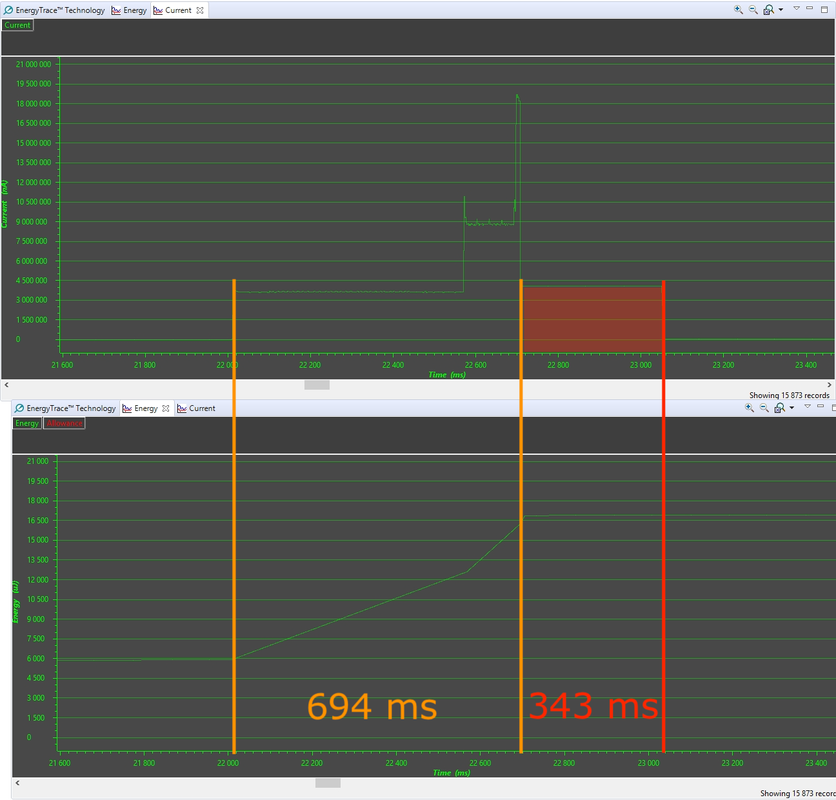
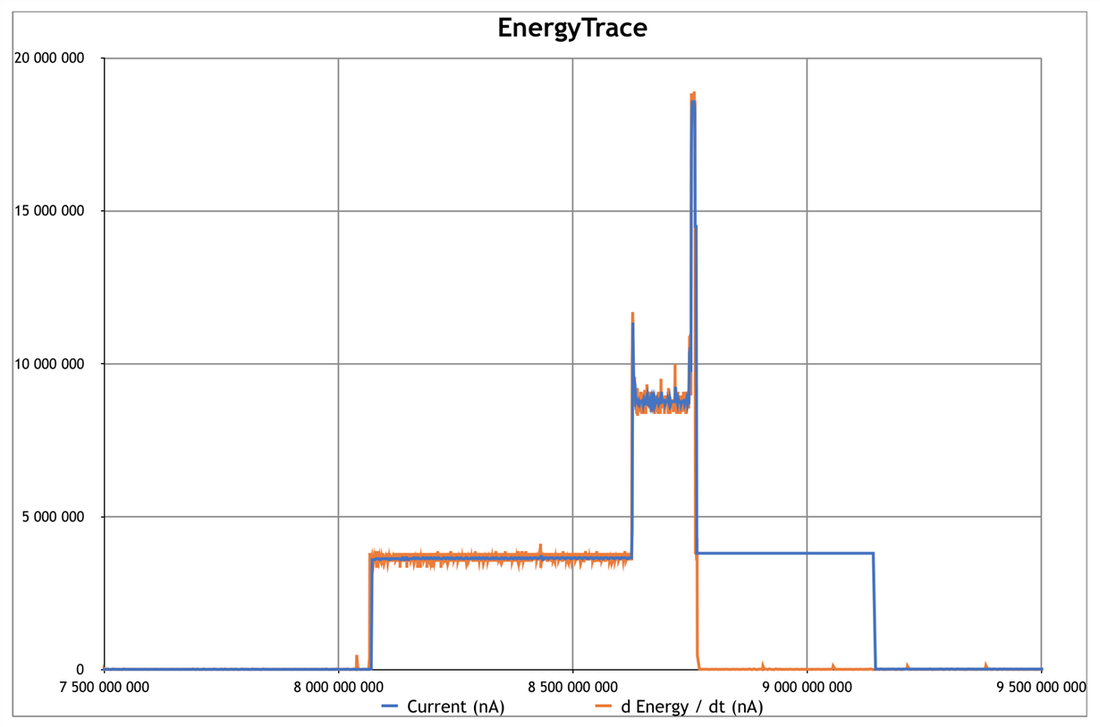
However, there is an issue with the consistency between the Current and the Energy measures and graphs.
The Energy graph reports cumulated power usage in joule while the Current reports instant current in nA. After the peak of power related to radio transmission ca. 22700 ms, the CC1310 goes back to low power mode.
This issue seems to be inherent to the EnergyTrace technology, as answered at the thread CCS8.1.0 — EnergyTrace Current and Energy Graphs Consistency from the E2E forum. |
|
|
As a solution, values need to be exported and the .csv file opened with Excel. Then current can be derived from cumulated Energy (uJ), and then converted into current in A.
On graph shown right, the Current measures are in blue, and the derived instant Energy calculations in orange, albeit rather noisy. |
|
|
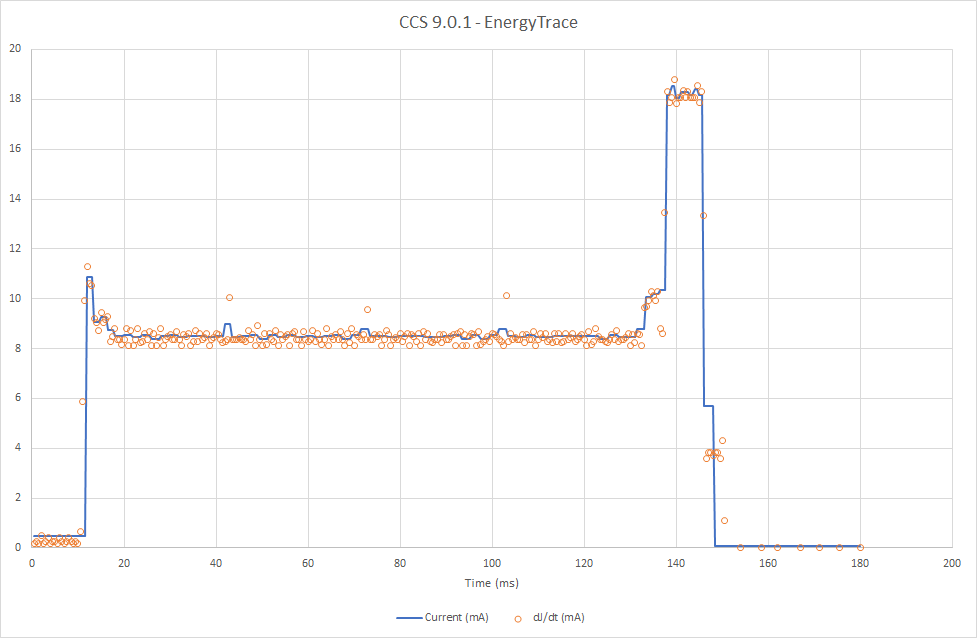
Release 9.0.1 of CCS has fixed the issue. The two series Current and Energy are consistent now.
As before, the Current measures are in blue, and the derived instant Energy calculations in orange albeit rather noisy. |
|
Conclusion
|
The major feature of the XDS110 is EnergyTrace, with a high level of insight through different methods.
As always, Texas Instruments provides excellent documentation. Here are some interesting links: Let's hope the consistency between the EnergyTrace measures could be improved and more prominent warnings be mentioned in both the documentation and in Code Composer Studio. |
|
Pros
|
Cons
|
Wrap-Up
|
Links

Posted: 09 Aug 2018
Updated: 17 Aug 2018, 02 May 2019, 04 Mar 2020
