Ultra-Low Power with EnergyTrace
|
Power management is critical to embedded systems. The MSP430 and SimpleLink MCUs are promoted as ultra-low power MCUs.
More interestingly, Texas Instruments provides both the APIs to manage power and the tools to measure it. The main article discusses how to measure with EnergyTrace. Additional articles show how to implement low power modes with Energia and Energia MT. |
|
|
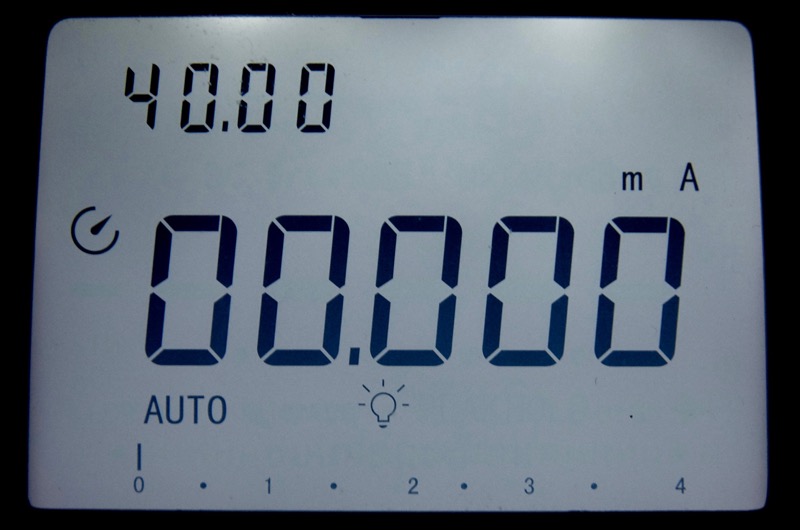
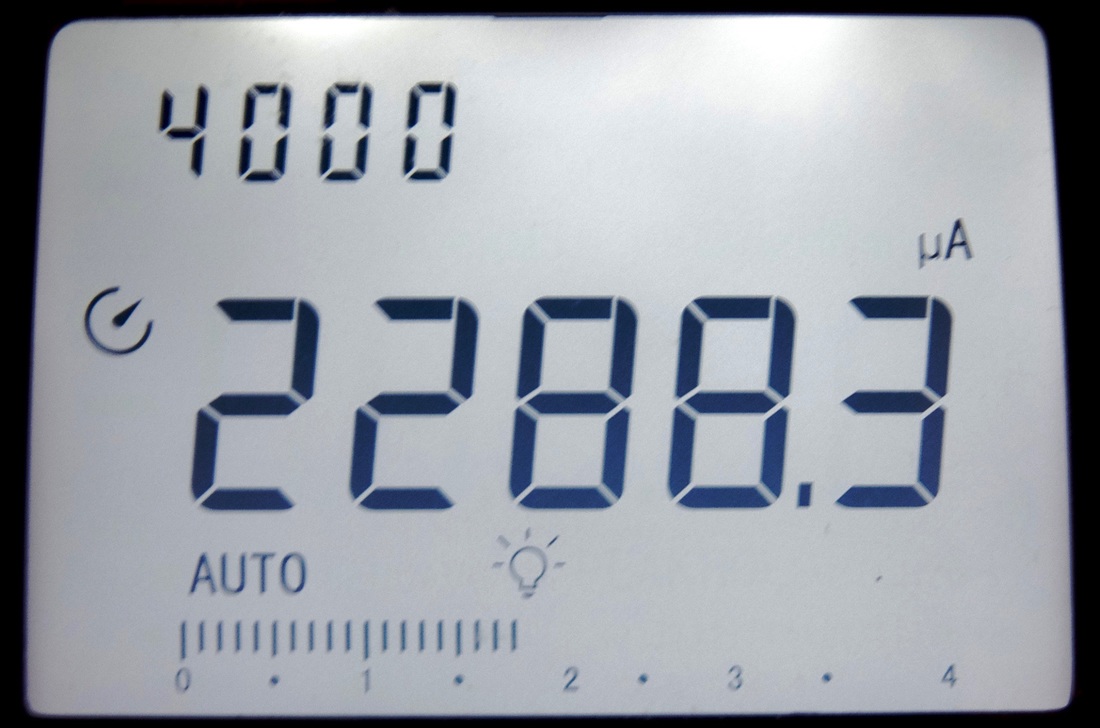
One major issue with standard DMMs is called burned voltage. Current measurement is based on measuring the drop in voltage across a shunt resistor. Problem is, this voltage drop may affect the circuit.
Measuring low current is still possible but with more expensive DMMs, called ammeters. I recommend reading the Low Power Measurements Handbook by Keithley / Tektronix. |
Same circuit current measured on the same DMM with 2 different ranges.
|
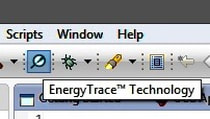
EnergyTrace
|
EnergyTrace is a combination of software and hardware, and comes in three levels:
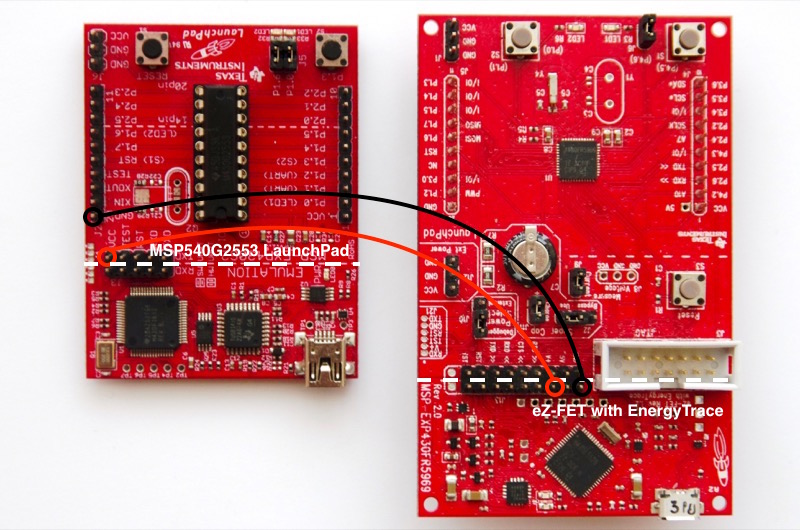
The hardware doesn't need a dedicated and expensive programmer. The programmer of most of the LaunchPad boards suits perfectly, including ez-FET and XDS110-ET. If the LaunchPad programmer doesn't feature EnergyTrace, the programmer of another LaunchPad can be used. For example, the EnergyTrace-compatible programmer from the LaunchPad MSP430FR5969 is connected to the LaunchPad MSP430G2553. Remove all the jumpers and connect the +3.3V and Ground lines. |
|
|
The software is included in CCS and tracks power consumption and requires a compatible programmer.
CCS should identify the USB port automatically.
If breakpoints have been defined, call instead the menu Run > Free Run to ignore the breakpoints and the power consumption associated with debugging. |
|
Comparing to a Reference
|
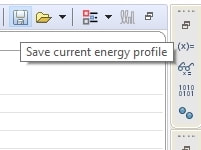
To measure how power consumption has been optimised, the best way is to compare to a reference.
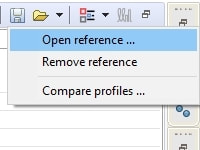
The reference would be the first EnergyTrace record, saved. After the code is modified, the first EnergyTrace record is loaded as reference and a new recording is launched. |
|
|
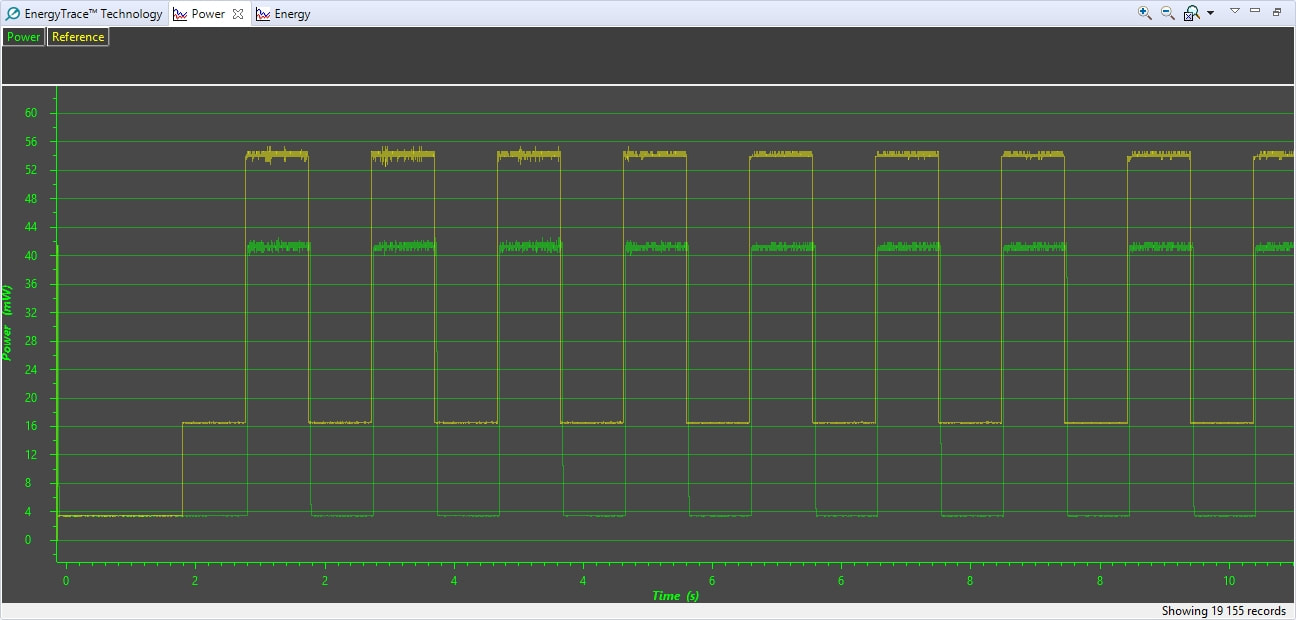
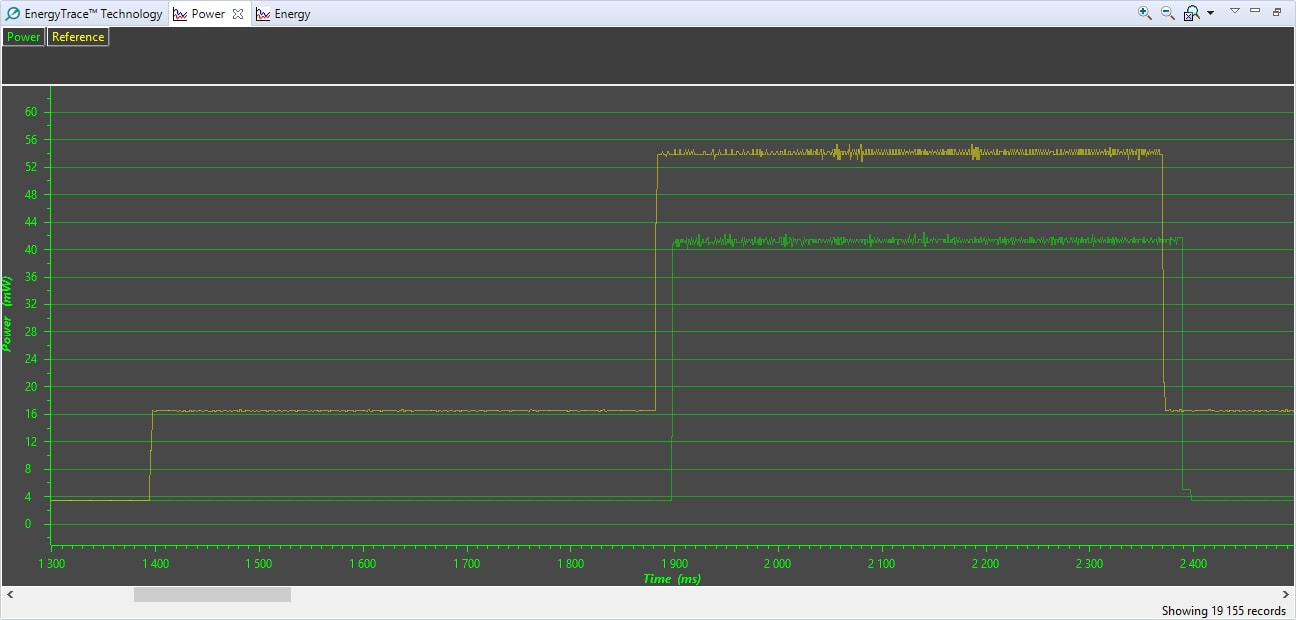
EnergyTrace displays the reference in yellow and the new trace in green.
|
|
|
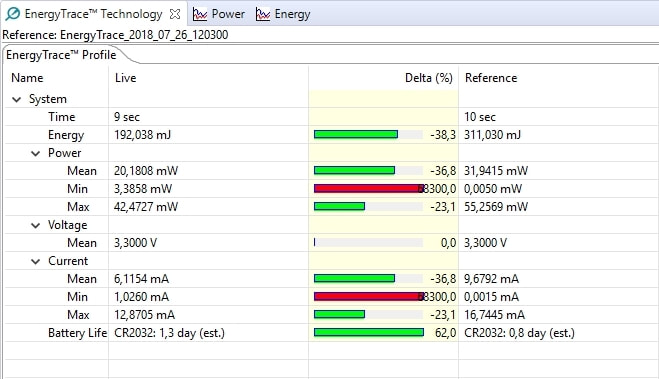
Additionally, EnergyTrace provides all the metrics.
In this example, battery life has increased by 62%. |
|
Setting a Trigger for Better Synchronisation
|
The immediate issue when comparing to a reference is to get the two traces synchronised.
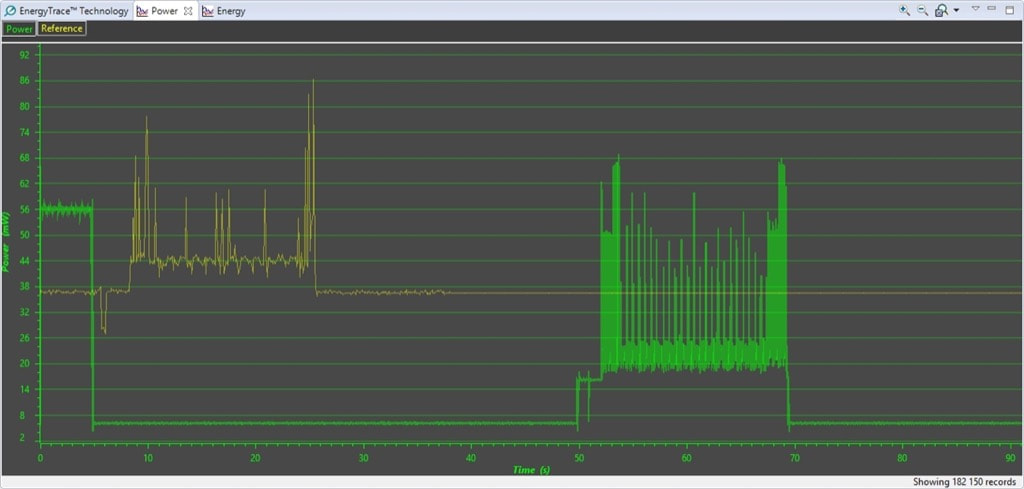
On the screen shown right, reference is shown in yellow and current measurement in green. However, the peeks of power consumption are not synchronised. |
|
|
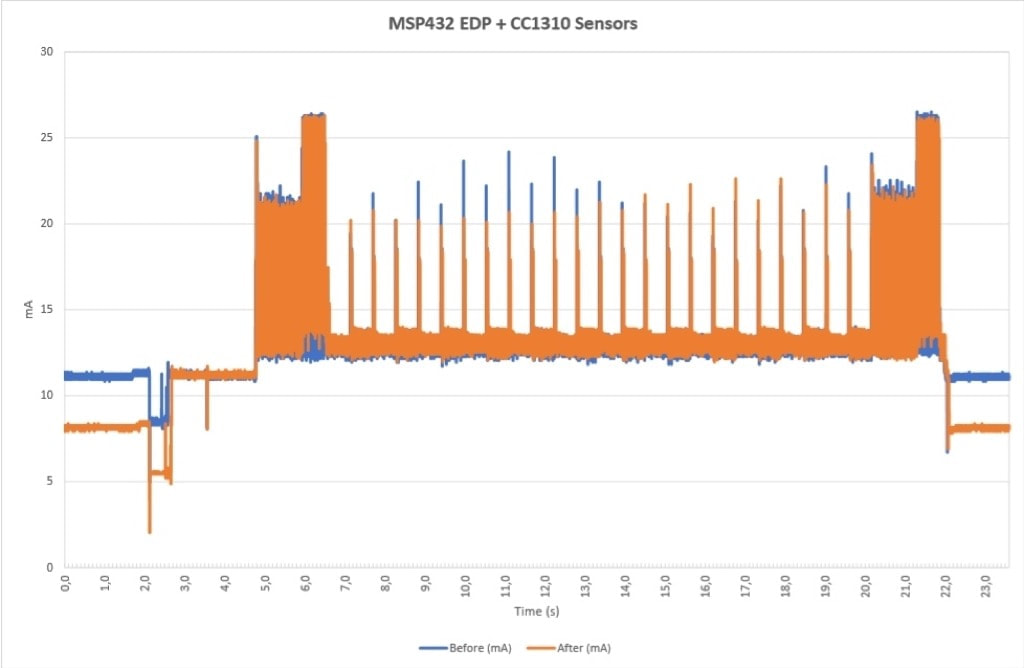
As an option, the traces can be saved as CSV files and reworked using any spreadsheet like Excel. Be ready for very large files, as EnergyTrace records every 500 us.
On the screen shown right, reference is shown in blue and current measurement in orange. Both have been synchronised manually. Using Energia MT and the Galaxia library saves 3 mA for the same application. |
|
|
But there is a better solution.
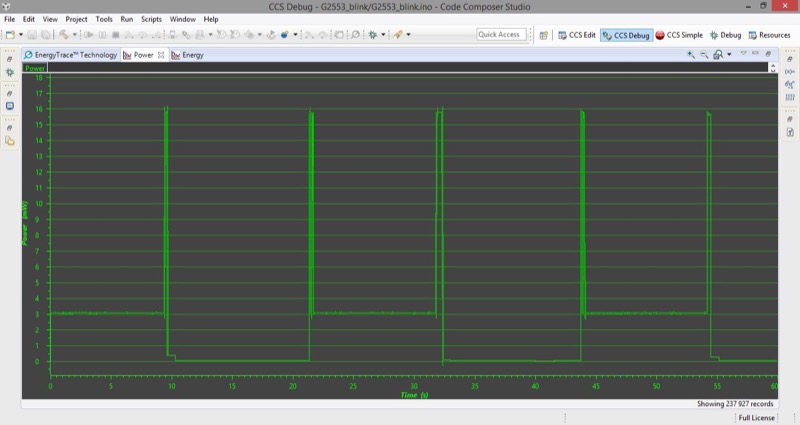
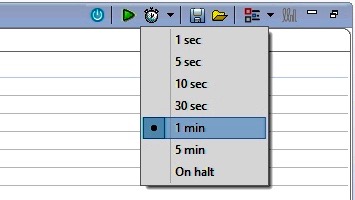
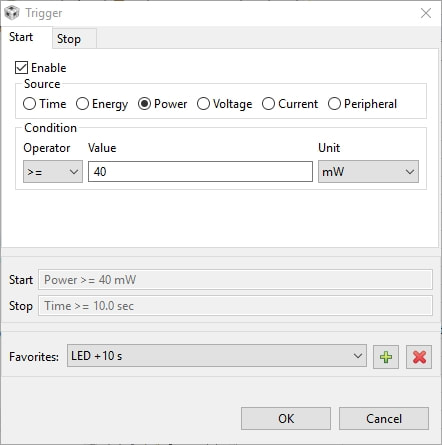
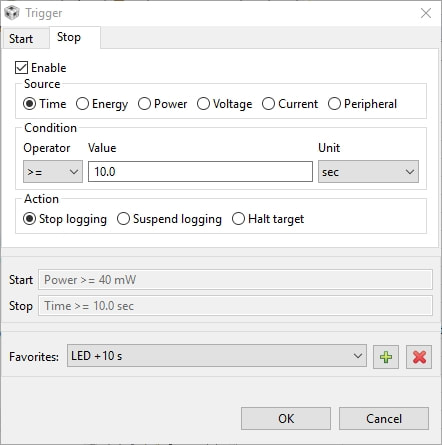
EnergyTrace offers options for setting triggers to start and stop recording. On the example show right,
Toggling a LED on then off for 10 ms starts the recording, as a LED requires 41 mW. The parameter can be saved as Favourite for later reuse, here called LED + 10 s. |
|
|
This technique delivers pretty good results, here about 10 ms.
The LED are toggled every 500 ms. |
|
Fixing Consistency Issue Between Measures
|
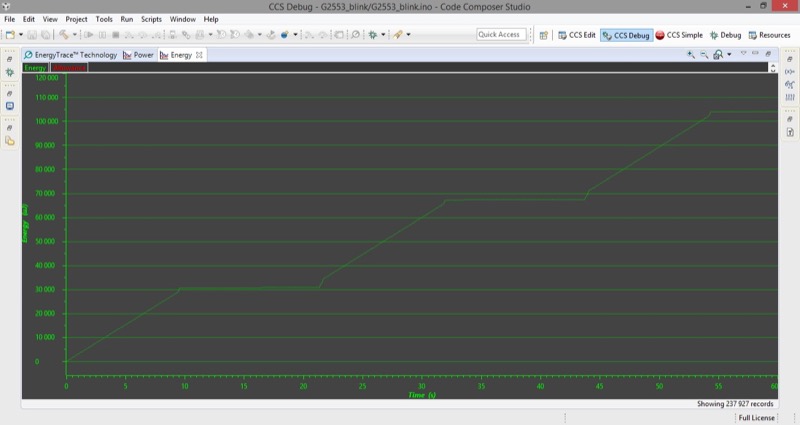
This bug affects Code Composer Studio release prior to 9.0.1.
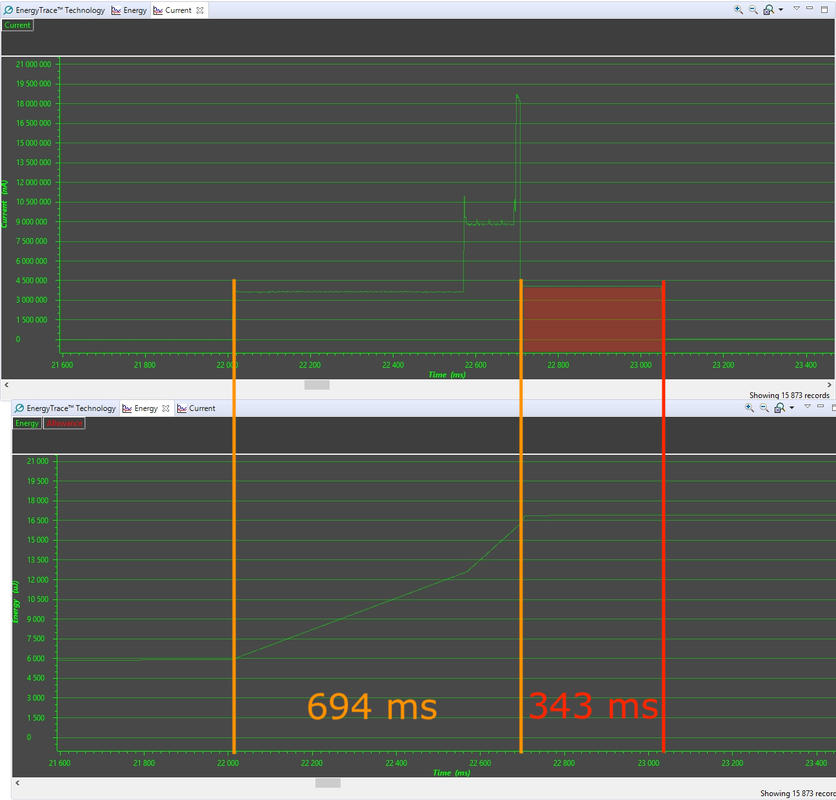
However, there is an issue with the consistency between the Current and the Energy measures and graphs. The Energy graph reports cumulated power usage in joule while the Current reports instant current in nA. After the peak of power related to radio transmission ca. 22700 ms, the CC1310 goes back to low power mode.
This seems to be inherent to the EnergyTrace technology, as answered at the thread CCS8.1.0 — EnergyTrace Current and Energy Graphs Consistency from the E2E forum. |
|
|
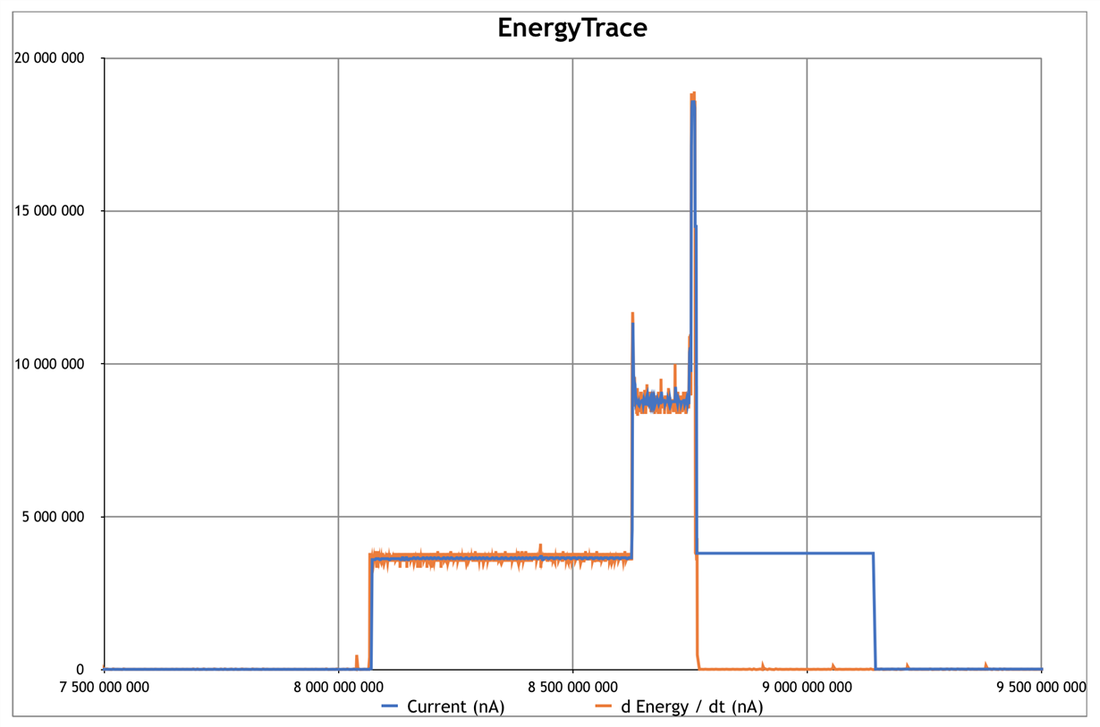
As a solution, values need to be exported and the .csv file opened and processed with Excel. Cumulated Energy (uJ) is derived and then converted into current in A.
On graph shown right, the Current measures are in blue, and the derived instant Energy calculations in orange. |
|
|
Code Composer Studio release 9.0.1 brings the much-awaited fix.
Both Current and Energy graphs are now consistent. |
|
Conclusion
|
The EnergyTrace technology offers a graphical measurement and follow-up of power consumption. Various LaunchPad boards come with a compatible programmer. There are also USB solutions like the XDS110 Debug Probe with EnergyTrace.
The only drawback relies on having to install the whole CCS IDE and its drivers. More specific optimisation techniques are discussed for Ultra-Low Power with MSP430 and Ultra-Low Power with Energia MT and Galaxia. |
|
Posted: July 26, 2018
Updated: August 09, 2018; August 17, 2018
