Graphics: Multiple Histogram
|
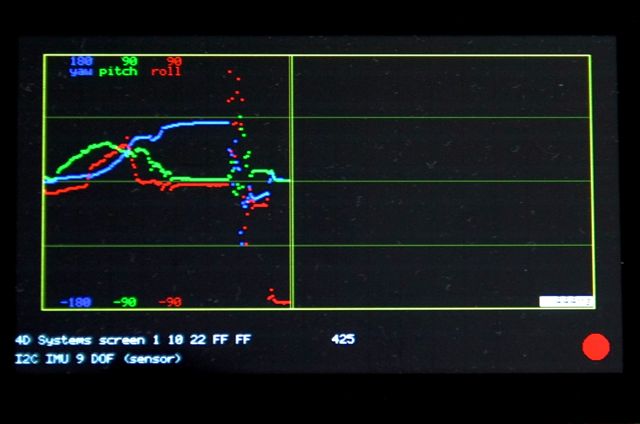
The new gMultiple is very close to the gHistogram graphic except that it can display up to four series.
The gMultiple is a class and contains, apart from the constructor, two functions: dDefine and draw. It displays:
The example shown on the right display the yaw, pitch and roll angles provided by an inertial measurement unit. |
|
Define
|
The dDefine function defines an multiple graphic with the following parameters:
Required parameters
Optional parameters for other series with default values
|
Code Editor
|
Draw
|
The draw() function updates the graphic with the values for each series.
When lapse is set to 0 (default), all values are displayed and there's no control of the period. When lapse is defined (>0), the period of time between two consecutive measures is monitored:
|
|
