Embedded Computing
  • About
  • Blog
  • Hardware
    • Which Platform?
    • Controller Platforms >
      • Adafruit Platform
      • Arduino Plaform
      • BBC micro:bit
      • Espressif Platform
      • iLabs Platform
      • Raspberry Pi Platform (MCU)
      • Seeed Platform
      • Silicon Labs Platform
      • Teensy Plaform
    • Computer Platforms >
      • BeagleBone Platform
      • Raspberry Pi Platform (SBC)
      • UDOO Platform
    • Peripherals >
      • Shields
      • Grove System
      • Sensors
      • Actuators
    • Displays >
      • E-Paper Displays
      • Reflective Displays
      • TFT Displays
      • LCD Displays
    • Legacy Platforms >
      • chipKIT Plaform
      • 4D Systems Platform
      • Intel Platform
      • LaunchPad Plaform
      • BoosterPacks for LaunchPads
      • LightBlue Bean
      • Maple Plaform
      • Mediatek Platform
      • Microsoft Azure IoT DevKit
      • Particle Platform
  • Software
    • Exploring RTOS with Galaxia >
      • Event Library
      • Semaphore Library
      • Mailbox Library
      • Timer Library
      • Clock Library
      • SWI Library
      • Task Library
    • Ultra-Low Power with EnergyTrace >
      • Ultra-Low Power with MSP430
      • Ultra-Low Power with Energia MT and Galaxia
    • Using Integers Instead of Reals
    • Going Python?
  • IoT
    • IoT Platforms: Which Hardware? >
      • Matter with Silicon Labs MG24
    • IoT Services: Which Solution? >
      • Recommended IoT Solutions
      • Platform-Specific IoT Solutions
      • Other IoT Solutions
      • Not tested IoT Solutions
      • Notification Solutions
    • Get Date and Time from Internet with NTP
    • Fast and Easy WiFi Connection with QR-Code
  • Tools
    • How to Start?
    • Reference >
      • Asking for Help
      • Boards Pins Maps
      • Ruler
      • Boards and Plugs
      • I²C Logic Level Converter
      • Standards for Connectors
    • Training >
      • Texas Instruments Workshops
      • Embedded Systems: Shape The World — MOOC edX UTAustinX UT.6.02x
      • Embedded Systems - Shape The World: Microcontroller Input/Output — MOOC edX UTAustinX UT.6.10x
      • Embedded Systems - Shape The World: Multi-Threaded Interfacing — MOOC edX UTAustinX UT.6.20x
      • Real-Time Bluetooth Networks: Shape the World — MOOC edX UTAustinX UT.RTBN.12.01x
      • Systems Thinking with Texas Instruments Robotics System Learning Kit
    • Books >
      • Getting Started with the MSP430 LaunchPad
      • Getting Started with Arduino
      • Arduino Cookbook
    • IDE >
      • The Battle of IDEs
      • More Options
      • Assessing the Next Generation of IDEs
      • Tools for Documentation
    • Equipment >
      • Saleae Logic Analyser
      • Rigol DS1102E Oscilloscope
      • XDS110 Debug Probe with EnergyTrace​
      • Segger J-Link Programmer-Debugger
      • Nordic Power Profiler Kit II
  • Projects
    • Libraries >
      • Master I²C Software Library
      • Date and Time Library
      • highView Library Suite
      • Others Libraries
    • smartDevices >
      • I²C smartColours Smart Sensor
      • I²C smartRFID Smart Sensor
      • I²C smartLED Display
      • I²C smartControls Smart Device
      • I²C smartWiFi Smart Device
      • I²C smartBLE Smart Device
      • I²C smartNode Smart Device
    • IoT Projects >
      • Remote E-Paper Weather and Message Board
      • Typie-Walkie with LoRa and E-Paper Screen
      • Typie-Walkie with E-Paper Screen
      • Remote e-Paper Pictures Panel
      • Remote e-Paper Messages Panel
      • Industrial IoT Project
      • Remote Contactless Temperature Monitor
      • Using Node-RED for IIoT
      • Low Power Home Network Weather Monitoring
      • Updated Low Power Home Network Weather Monitoring
      • Weather and Security Station with Blynk
      • SensorTag to Blynk Using Node-RED
      • Pervasive Reporting
    • AI Projects >
      • Colour Recognition with Neural Network
    • Other Projects >
      • Air Quality Monitoring
      • Driving a Large E-Paper Display with a Compact Xiao RP2040
      • Low-Power E-Paper Weather Station
      • Portable Particulate​ Matter Monitor
      • FRAM-based E-Paper Screen Controller
      • General Purpose 3.5" Screen
      • Colour Recognition with Neural Network
      • A Low Power Weather Station
      • Digital Volt-Amp-Watt Meter
      • Mobile Measurement with LCD Display
      • Screen with SRAM for GUI
      • Volt-Amp-Watt-Meter for Grove
      • Multi-Touch Project with CapTIvate

hV_Graphics — Multiple

The histogram graphic displays up to four series of values on a time axis.

The gMultiple is a class and contains, apart from the constructor, two functions: dDefine and draw.

All parameters are integers with an optional unit.

A mutiple histogram is declared with the gMultiple class:

    
The gMultiple class has two functions:
  • dDefine, with related screen, with top-left coordinates, width and height of the graphic, name, minimum and maximum values, unit and colour for for each of the four series, lapse in ms, horizontal and vertical grids, continuity, back, front and grid colours:
Picture

    
Only the first series in required, others are optional. No memory option is offered for local maximum and minimum.
  • draw, with up to four values:

    
Setting memory to zero removes that feature, as pictured right.

The lapse option ensures the values are distanced in time by the number of milliseconds provided.

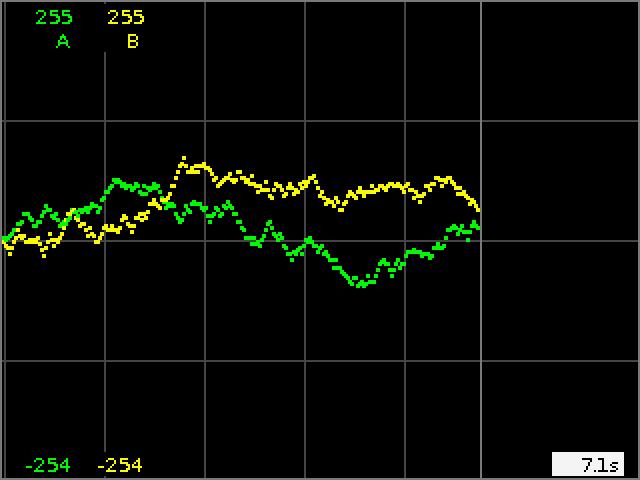
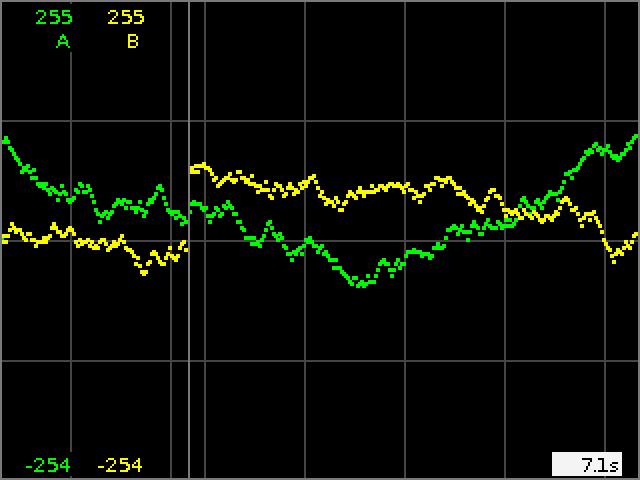
The continuity option manages how values are displayed once the right side has been reached.

With continuity turned off, a moving vertical cursor separates new and old values. When the cursor has reached the right side, it starts over from the left side. Then new values are printed on top of old values. This is the default option.

With continuity turned on, previous values are shifted to the left so new values are added to the right.

The whole graph seems to be animated.
Picture
To display one single series of values, consider the Histogram instead.
Powered by Create your own unique website with customizable templates.