Embedded Computing
  • About
  • Blog
  • Hardware
    • Which Platform?
    • Controller Platforms >
      • Adafruit Platform
      • Arduino Plaform
      • BBC micro:bit
      • Espressif Platform
      • iLabs Platform
      • Raspberry Pi Platform (MCU)
      • Seeeduino Platform
      • Teensy Plaform
    • Computer Platforms >
      • BeagleBone Platform
      • Raspberry Pi Platform (SBC)
      • UDOO Platform
    • Peripherals >
      • Shields
      • Grove System
      • Sensors
      • Actuators
    • Displays >
      • E-Paper Displays
      • Reflective Displays
      • TFT Displays
      • LCD Displays
    • Legacy Platforms >
      • chipKIT Plaform
      • 4D Systems Platform
      • Intel Platform
      • LaunchPad Plaform
      • BoosterPacks for LaunchPads
      • LightBlue Bean
      • Maple Plaform
      • Mediatek Platform
      • Microsoft Azure IoT DevKit
      • Particle Platform
  • Software
    • Exploring RTOS with Galaxia >
      • Event Library
      • Semaphore Library
      • Mailbox Library
      • Timer Library
      • Clock Library
      • SWI Library
      • Task Library
    • Ultra-Low Power with EnergyTrace >
      • Ultra-Low Power with MSP430
      • Ultra-Low Power with Energia MT and Galaxia
    • Using Integers Instead of Reals
  • IoT
    • IoT Platforms: Which Hardware?
    • IoT Services: Which Solution? >
      • Recommended IoT Solutions
      • Platform-Specific IoT Solutions
      • Other IoT Solutions
      • Not tested IoT Solutions
      • Notification Solutions
    • Get Date and Time from Internet with NTP
    • Fast and Easy WiFi Connection with QR-Code
  • Tools
    • How to Start?
    • Reference >
      • Asking for Help
      • Boards Pins Maps
      • Ruler
      • Boards and Plugs
      • I²C Logic Level Converter
      • Standards for Connectors
    • Training >
      • Texas Instruments Workshops
      • Embedded Systems: Shape The World — MOOC edX UTAustinX UT.6.02x
      • Embedded Systems - Shape The World: Microcontroller Input/Output — MOOC edX UTAustinX UT.6.10x
      • Embedded Systems - Shape The World: Multi-Threaded Interfacing — MOOC edX UTAustinX UT.6.20x
      • Real-Time Bluetooth Networks: Shape the World — MOOC edX UTAustinX UT.RTBN.12.01x
      • Systems Thinking with Texas Instruments Robotics System Learning Kit
    • Books >
      • Getting Started with the MSP430 LaunchPad
      • Getting Started with Arduino
      • Arduino Cookbook
    • IDE >
      • The Battle of IDEs
      • More Options
      • Assessing the Next Generation of IDEs
      • Tools for Documentation
    • Equipment >
      • Saleae Logic Analyser
      • Rigol DS1102E Oscilloscope
      • XDS110 Debug Probe with EnergyTrace​
      • Segger J-Link Programmer-Debugger
      • Nordic Power Profiler Kit II
  • Projects
    • Libraries >
      • Master I²C Software Library
      • Date and Time Library
      • highView Library Suite
      • Others Libraries
    • smartDevices >
      • I²C smartColours Smart Sensor
      • I²C smartRFID Smart Sensor
      • I²C smartLED Display
      • I²C smartControls Smart Device
      • I²C smartWiFi Smart Device
      • I²C smartBLE Smart Device
      • I²C smartNode Smart Device
    • IoT Projects >
      • Typie-Walkie with LoRa and E-Paper Screen
      • Typie-Walkie with E-Paper Screen
      • Remote e-Paper Pictures Panel
      • Remote e-Paper Messages Panel
      • Industrial IoT Project
      • Remote Contactless Temperature Monitor
      • Using Node-RED for IIoT
      • Low Power Home Network Weather Monitoring
      • Updated Low Power Home Network Weather Monitoring
      • Weather and Security Station with Blynk
      • SensorTag to Blynk Using Node-RED
      • Pervasive Reporting
    • AI Projects >
      • Colour Recognition with Neural Network
    • Other Projects >
      • Driving a Large E-Paper Display with a Compact Xiao RP2040
      • Low-Power E-Paper Weather Station
      • Portable Particulate​ Matter Monitor
      • FRAM-based E-Paper Screen Controller
      • General Purpose 3.5" Screen
      • Colour Recognition with Neural Network
      • A Low Power Weather Station
      • Digital Volt-Amp-Watt Meter
      • Mobile Measurement with LCD Display
      • Screen with SRAM for GUI
      • Volt-Amp-Watt-Meter for Grove
      • Multi-Touch Project with CapTIvate

Software

I tried the software version 1.1.34 on 2 laptops, one running on Mac OS X.10 Yosemite and another on Windows 8.1. Everything ran fine on both. 

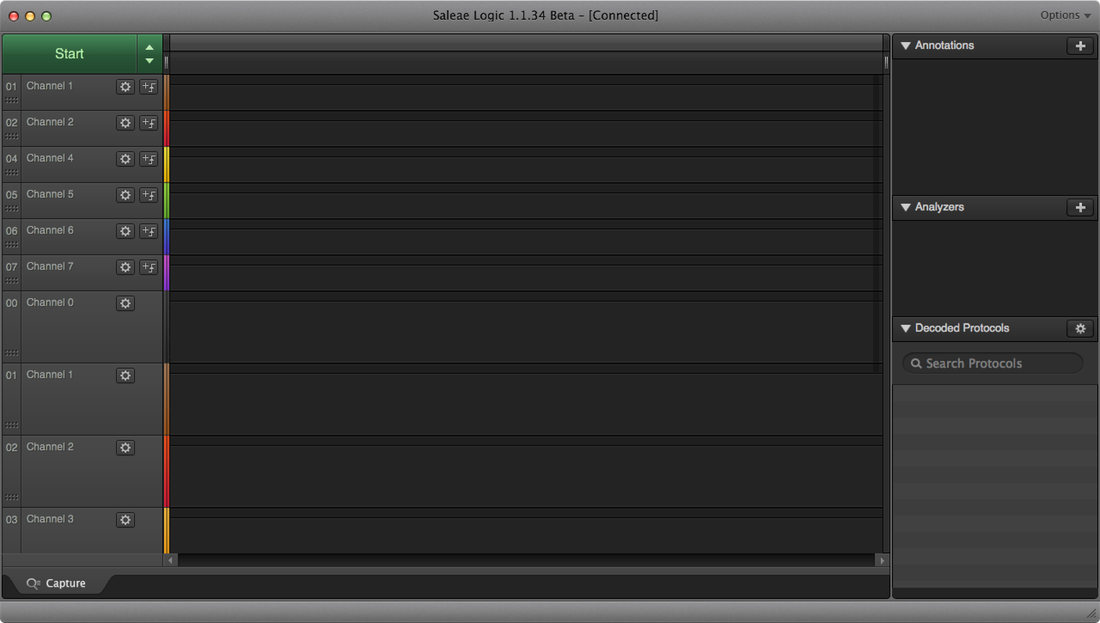
I'm updating the review with software version 1.2.1, available for Mac OS and Linux only.

At launch, the main screen shows the available channels, a configuration menu with a big start button, a pull-down Options menu, and three dedicated areas for Annotations, Analysers and Decoded Protocols.
Picture

Configure the Channels, Modes and Sampling Rates

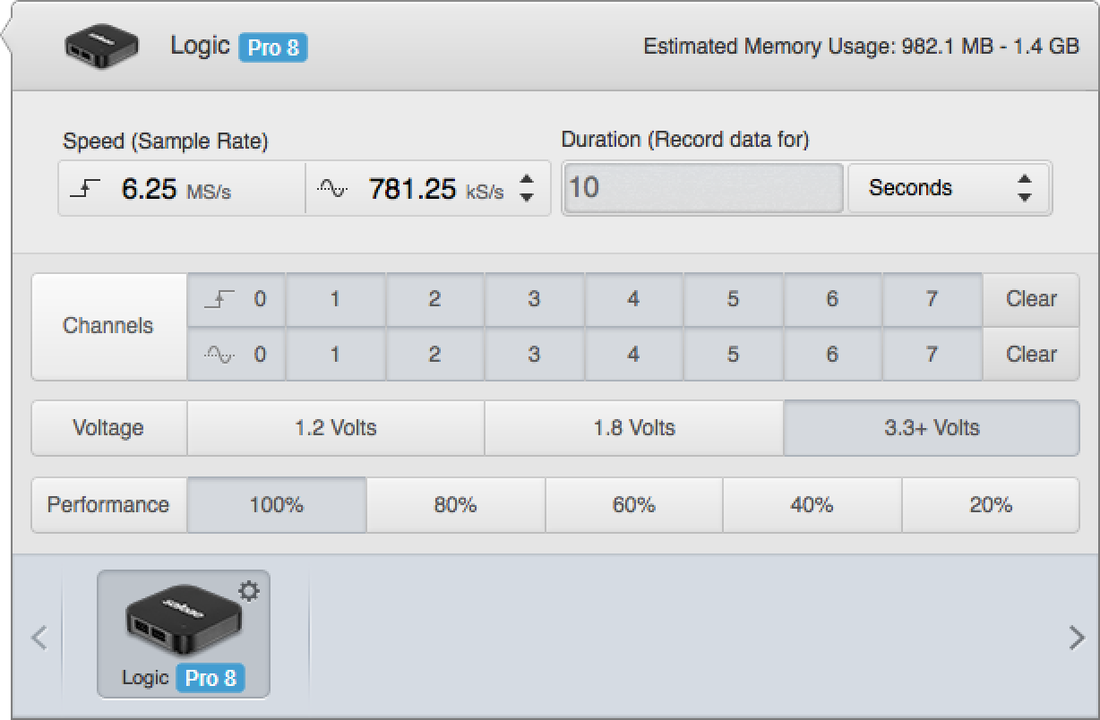
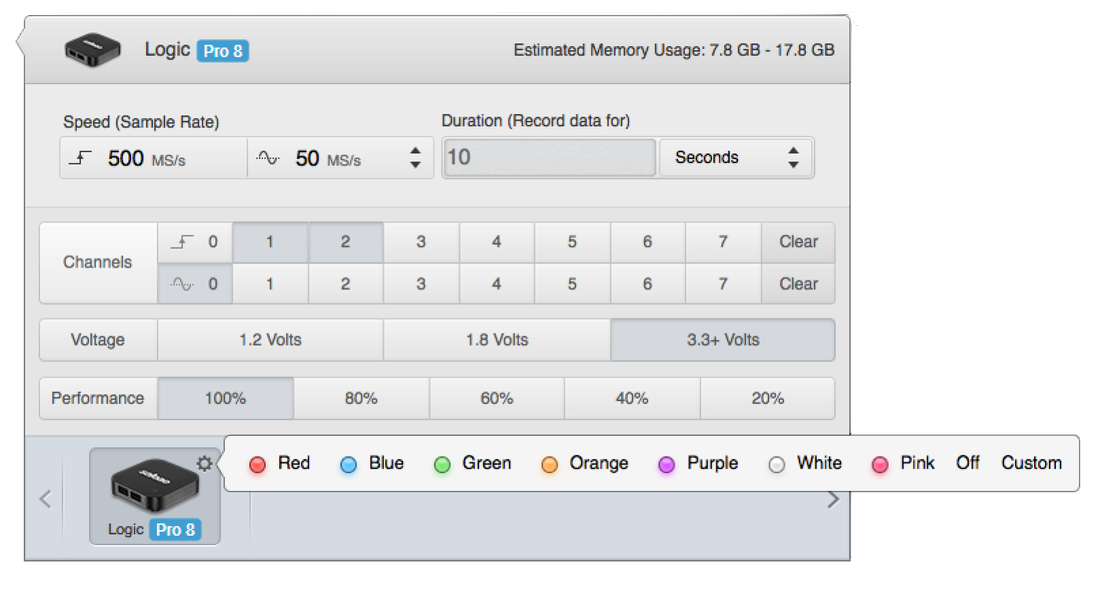
The first thing to do is to configure what to acquire:
  • select the channels, 
  • define the digital and/or analog modes for each channel, 
  • and set the corresponding sampling rates for digital and analog signals. 

All this has a direct impact on the size of data collected, and thus on system requirements. 

To put things in perspective, recording 10 seconds at 10 MS/s sampling rates gives 1 billion potential measures for one channel. 
Picture
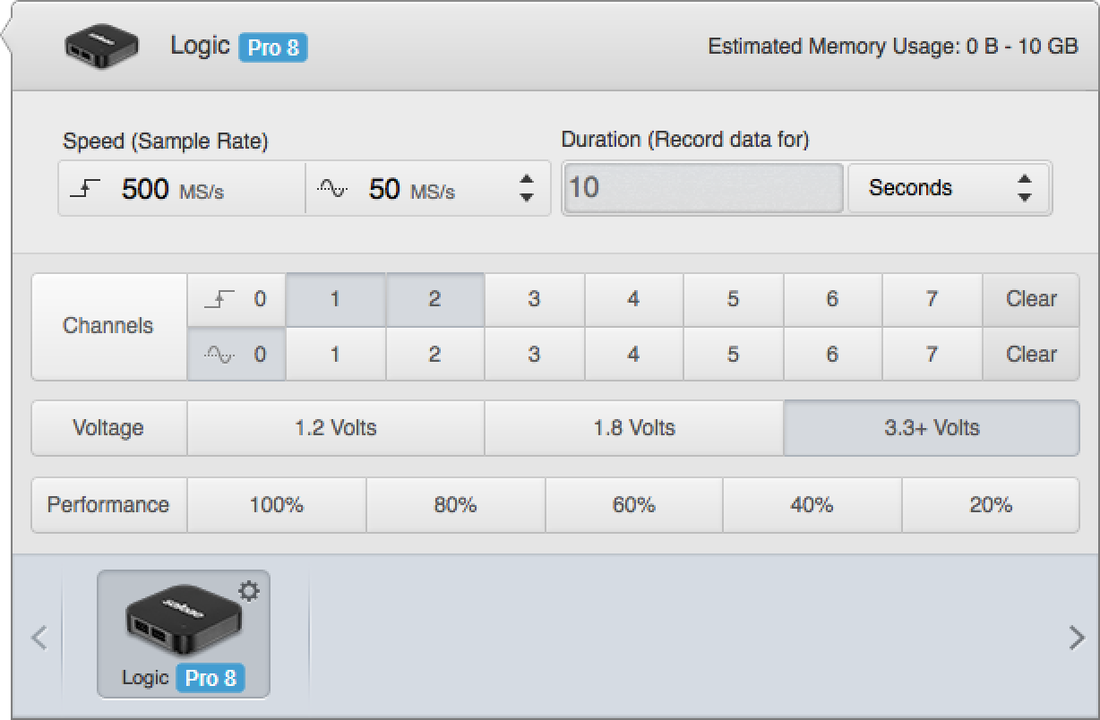
In the example shown on the right, 
  • channels 1 and 2 are selected on digital mode,
  • channel 0 is selected on analog mode,
  • recording sequence lasts 10 seconds, 
  • voltage is set to 3.3 V,
  • sampling rate is 500 MS/s for digital and 50 MS/s for analog,
  • memory usage is estimated up to 10 GB.

Mid-grey for selected channels and light-grey for unselected channels isn't very easy to interpret.
Picture
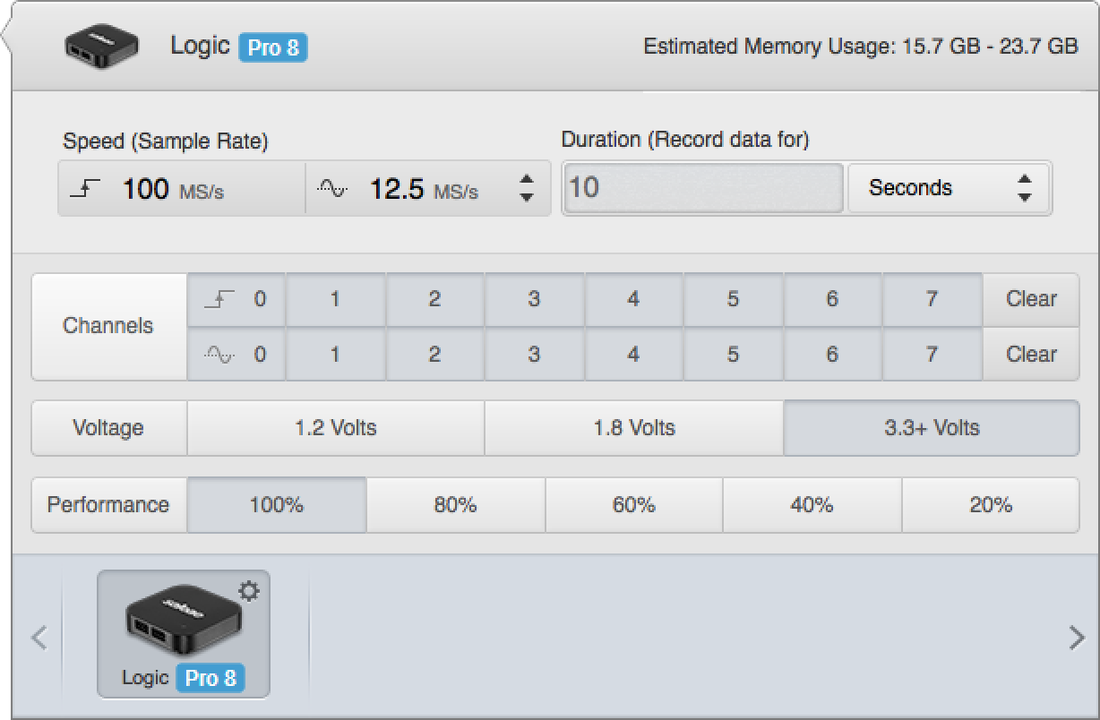
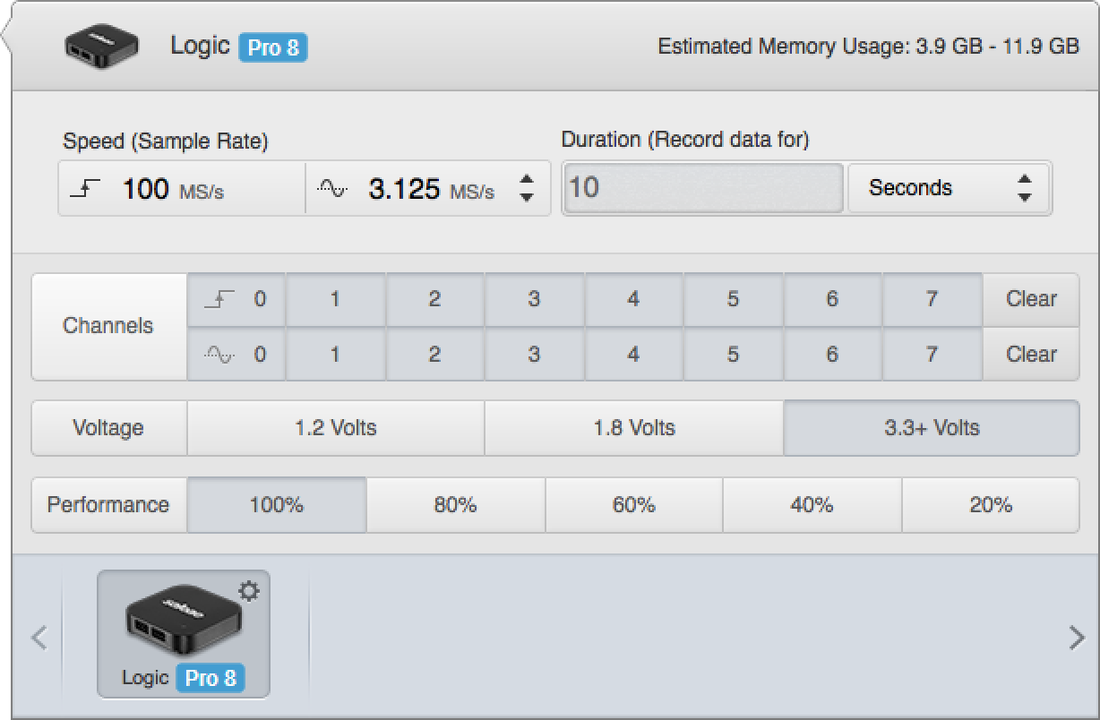
An Estimated Memory Usage is shown for each selection and updated for every change. The same 10 seconds recording requires (below, for left to right) 
  • 16~24 GB at 100 MS/s digital and 12.5 MS/s analog, 
  • 4~12 GB at 100 MS/s digital and 3.125 MS/s analog,
  • and less than 2 GB at 6.25 MS/s digital and 781.25 kS/s analog.
Picture
Picture
Picture
Recording 10 seconds at 100 MS/s gives 1 billion potential measures. Fast sample rates require a powerful computer with large amount of RAM and fast processor. 

I ran the same 1 billion measures test, with two digital channels for I²C at 100 MS/s and one analog channel at 12.5 MS/s , on 2 laptops: 
  • On a MacBook Pro 13" running on Mac OS X.10 Yosemite with 8 GB of RAM and dual-core i5 @ 2.6 MHz CPU, everything went fine: acquiring, analysing and exporting to a gigantic 12 GB file.
  • On a HP Pavilion running on Windows 8.1 with 8 GB of RAM and dual-core i5 @ 2.5 MHz , it crashed. On the Windows machine, RAM was saturated and Windows asked politely to close the application.

Running the same test at lower speeds with 6.25 MS/s for digital and 1.562 MS/s for analog went fine on both computers. So selecting the sample rate is key. 

Choose the Protocol

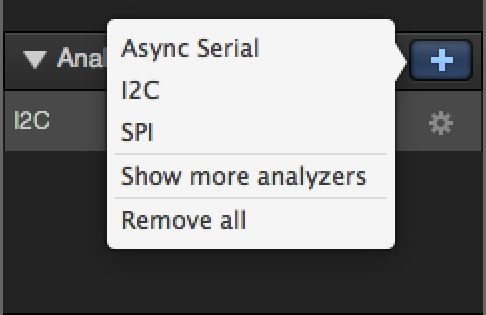
Protocol selection is done through the Analyzers drop-down menu. 
Picture
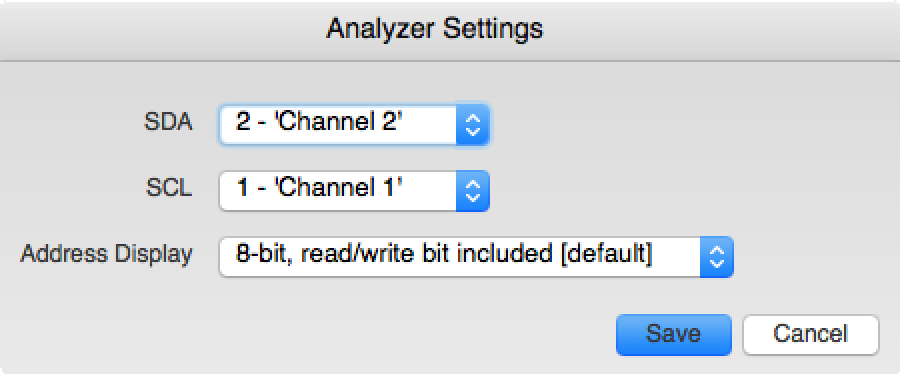
One windows pops-up and asks for the channels.
Picture
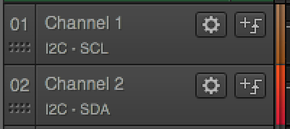
The protocol and signals appear under each channel.
Picture
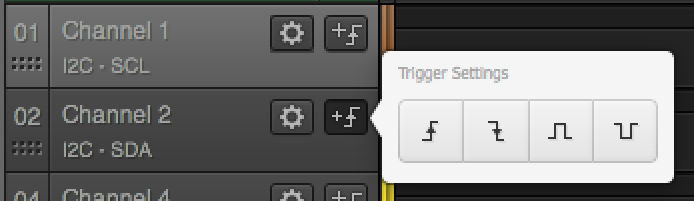
The protocols can be chosen before or after recording.

Triggers can also be defined.
Picture

Record

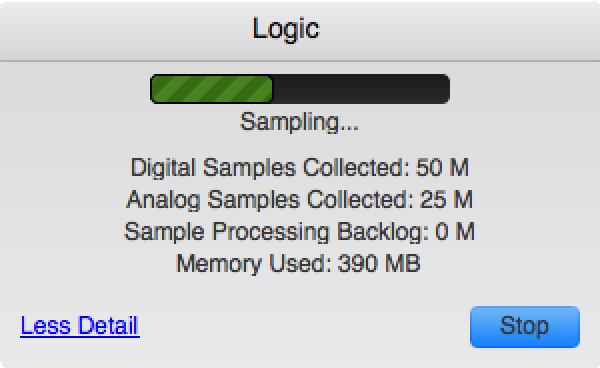
To start recording, just press the big green button Start. 

To stop recording, click on the Stop button on the pop-up window.

Picture
Picture

Analyse

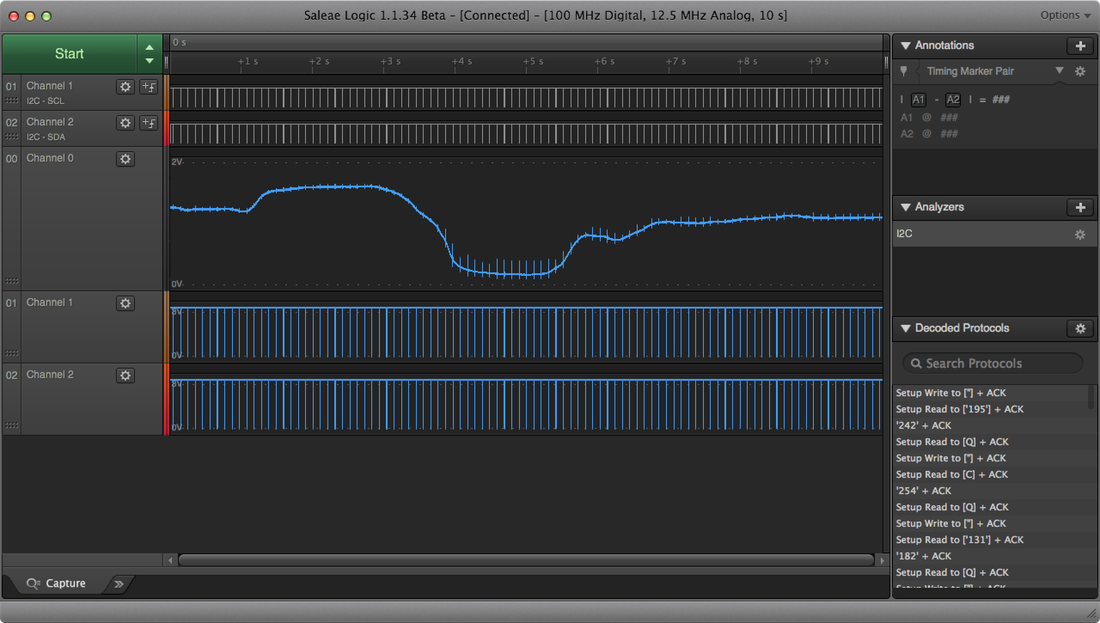
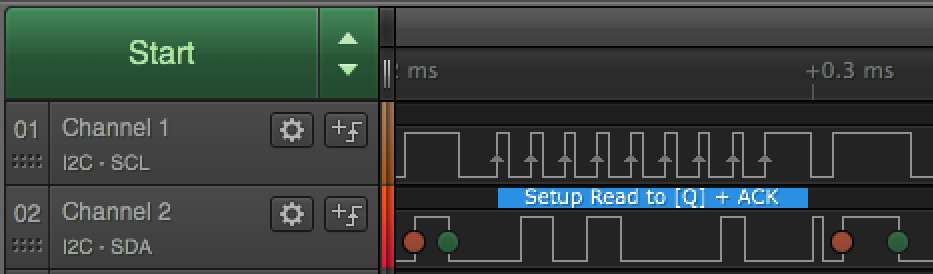
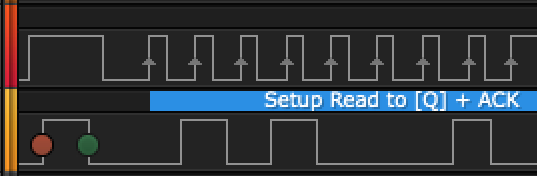
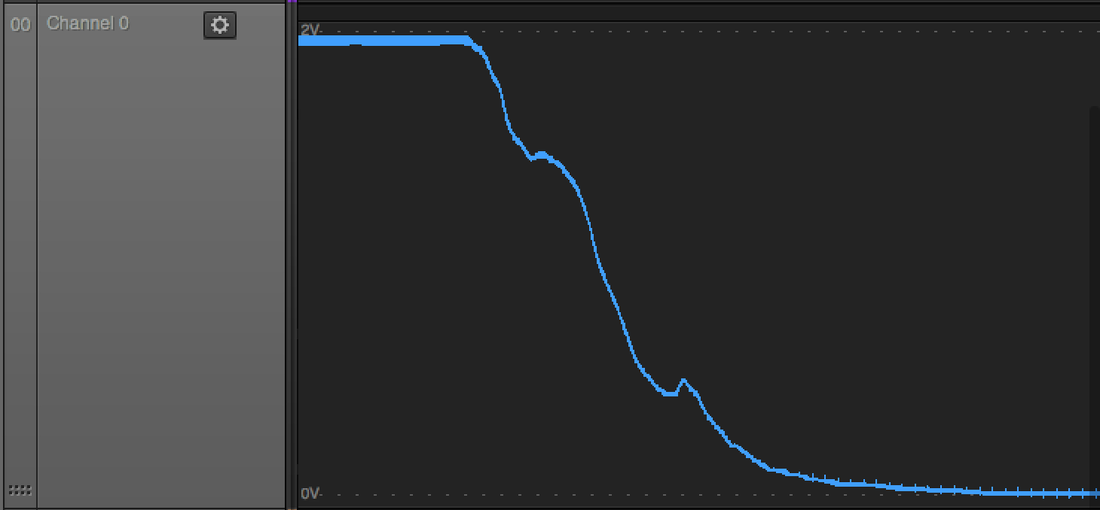
Left, zooming out for the analog signal. Click to enlarge.
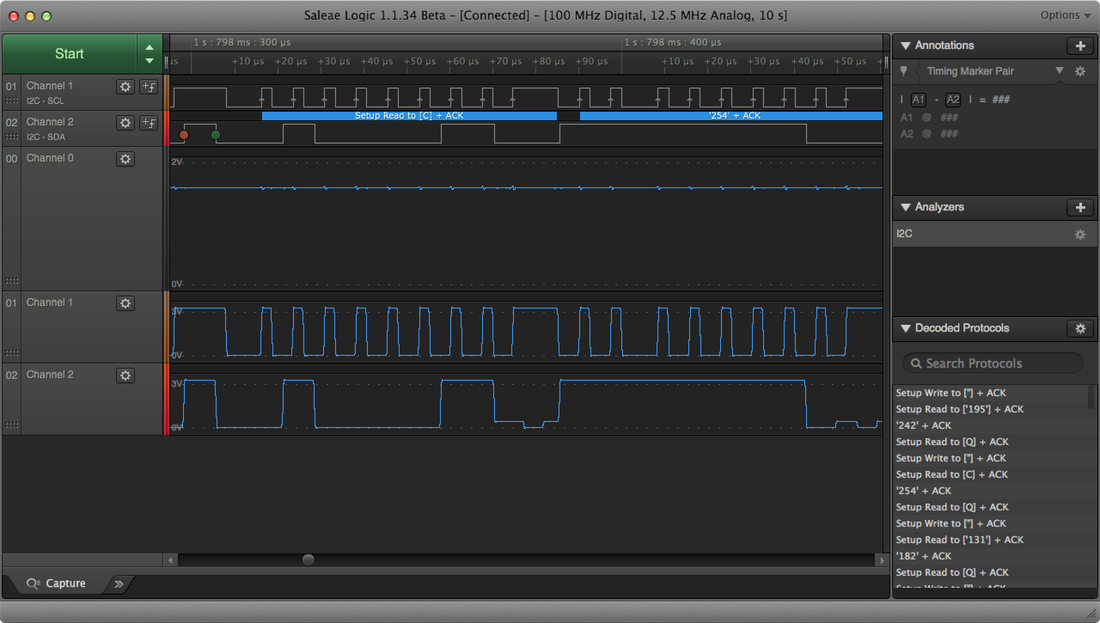
Right, zooming in for the I²C signal. Click to enlarge.

The decoded I²C protocol appears on the top, with the corresponding analog signals on the bottom.
Picture
Picture
The overall interface is very clean.

However, I'm not a big fan of some surprising choices that make it really difficult to read, especially for the text in light grey on a dark grey background.

Picture
Similarly, the characters of the labels don't leverage the high resolution of the Retina display.

Let's hope a future revision of the application includes support for Retina.


Picture
Version 1.2.1 still doesn't take advantage of the Retina display.
Picture
Further customisation of the interface is possible. 

For example, non required channels could be hidden.

Channels can also be zoomed in vertically up to 8x, very useful for analog signals.

Picture
Picture
Picture
Picture
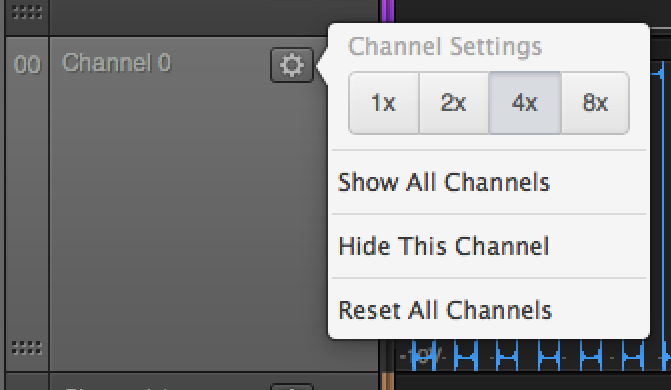
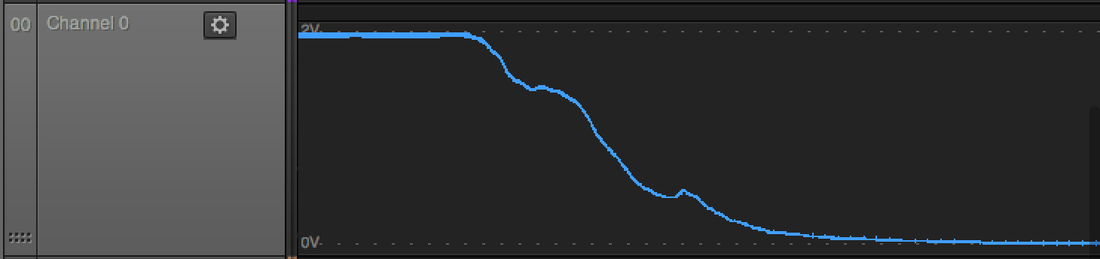
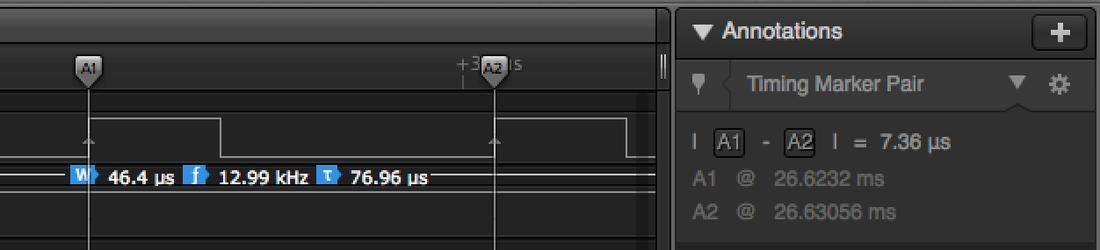
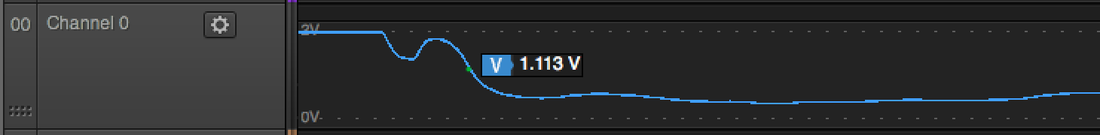
Annotations, bookmarks and timing markers can be added.

Here, time is measured between two timing markers.

Clicking on the signal provides additional information, like the 1.113 V voltage for the analog signal.
Picture
Picture

Other Options

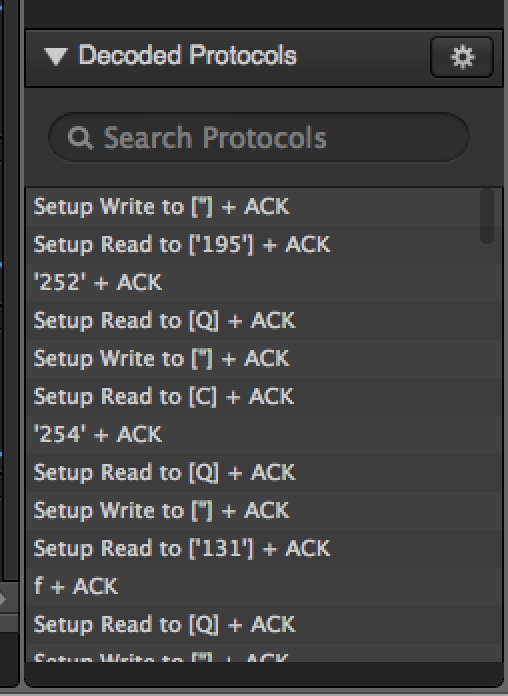
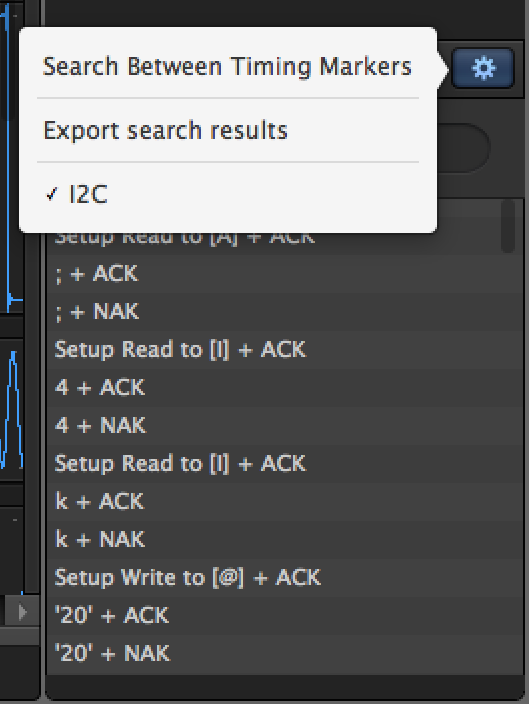
The Decoded Protocols area shows the signal, here the I²C protocol, in plain ASCII with the control sequences, Read/Write and ACK.
Picture
Search is now possible, only on single character.

Picture
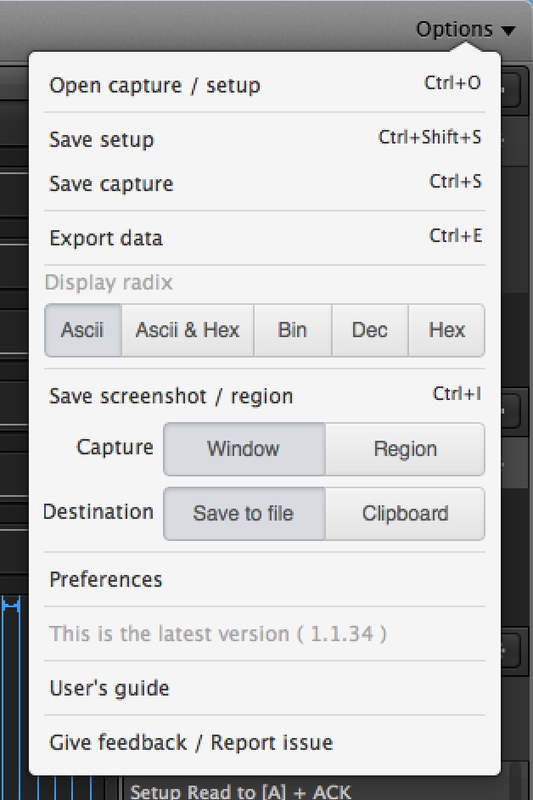
The options menu allows to export the capture and set the preferences.

Picture
The analyser has a RGB LED on the top. The light is very bright and useless. Here's the option to turn it off.

I'd like to use this RGB LED as a feed-back. 

For example, the LED is off when the analyser is inactive, green when it starts recording, turning yellow then red at the end of the sequence. 

Another idea, the LED would display the memory usage and how much remains free.
Picture
Some clever short-cuts are very handy. Here are some examples out of the full list. 

Also, standard gestures on the MacBook trackpad are used. Version 1.2.1 greatly improves the use of the trackpad: scroll left and right by moving two fingers. 

However, other coming gestures aren't supported yet: pinch to zoom in or out doesn't work. Similarly, the full screen mode doesn't hide the dock in Mac OS X.
  • right-arrow: go right
  • left-arrow: go left
  • N: jump to next signal change
  • P: jump to previous signal change
  • up-arrow: zoom in
  • down-arrow: zoom out

Real-Time

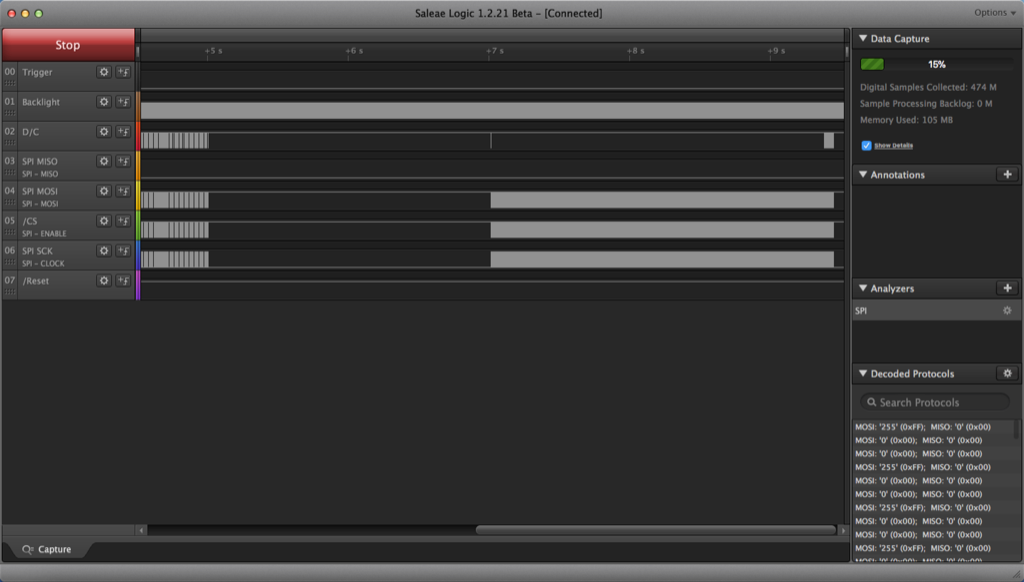
Release 1.2.21 (still in beta) features real-time view. The data recorded is shown on the screen.

The green Start button turns into a red Stop. Zoom-in and zoom-out are available but the analysers do not show decoding of the signals.
Picture

Conclusion

New releases bring many improvements over previous ones. The interface is more intuitive and faster to use. They bring many options to ease the analysis of the signals, like the vertical zoom for analog signals and the search for digital protocol. Real-time view (still in beta) offers a welcome addition.

In order to ensure optimal performance, don't forget to configure the channels, modes and sampling rates first before recording!

Surprisingly, releases 1.1.34 and 1.2.1 are still stated as beta. During the whole test, Logic was stable and never crashed on Mac OS X. Version 1.2.1 was also faster than version 1.1.34.
 
When Logic does plan to exit the beta state? 

Pros

  • Intuitive and fast interface
  • Many tools available
  • Search utility

Cons

  • High-resolution display and full screen mode not fully supported
  • Light grey text on dark grey background difficult to interpret and read
  • Still in beta

Wrap-Up

  • Plug-and-Play application
  • Set sampling rate first!

Next

  • Saleae Analysers
Powered by Create your own unique website with customizable templates.