Debugging against the Pico Board
|
There are different ways to carry debugging against the Raspberry Pi Pico:
|
|
Using the second core of the same Pico
|
Since the RP2040 features two cores, why not using one core to debug the other? This is the interesting approach to get a first look at debugging.
Alas, I couldn't manage to run the debugger and debug the application at the same time. I may have missed one step in the procedure. |
Using a second Pico board
|
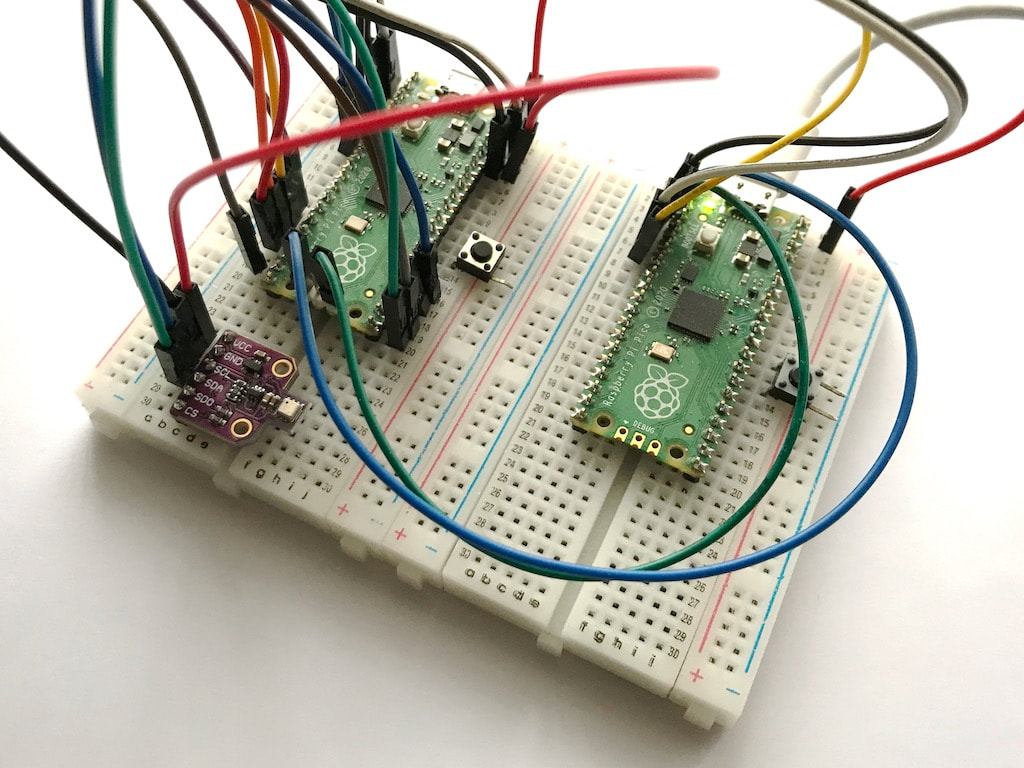
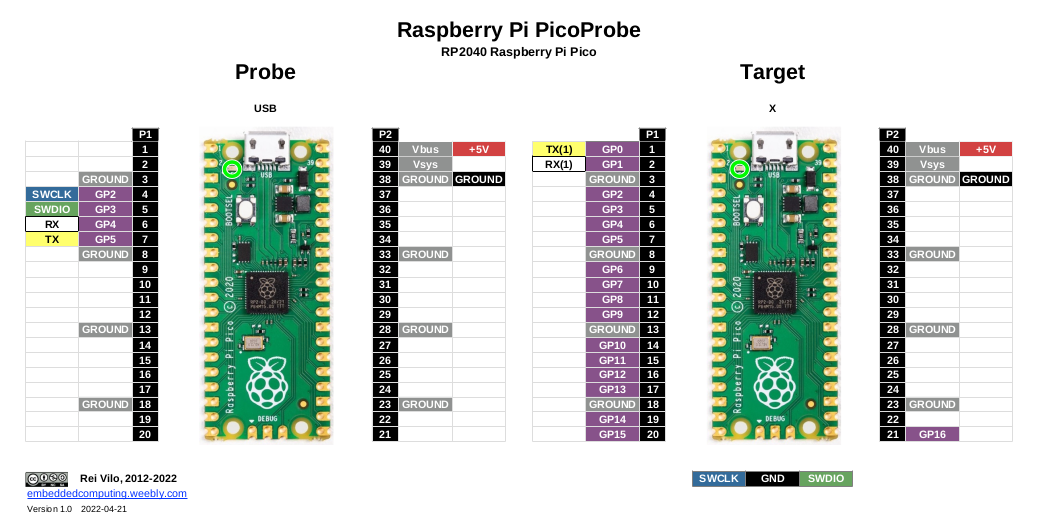
As the Pico goes for USD4, why not using a second Pico as a programmer-debugger?
Called PicoProbe, this solution works very well. The first Pico is turned into a programmer-debugger after flashing an executable available as a UF2 file. Then it is connected to the second Pico, the target. The programmer-debugger also reroutes the serial port from pin 0 and 1 of the target. The Serial port of the target is no longer Serial on the USB port, by Serial1 on pins 0 and 1. |
|
Using the Raspberry Pi Debug Probe
|
The Raspberry Pi Debug Probe offers a cleaner alternative. It offers two ports, one for programming and debugging, and another for the serial console, with the corresponding cables. It also includes a USB cable.
The cables come with different plugs, fool-proof 3-way JST-SH, and standard male and female 0.1". The 3-way JST-SH cable plugs directly into the JST-SH connector now featured on the Pico boards with headers, Pico H and Pico WH. The Debug Probe is based on the RP2040 MCU and provides the same features: upload and debug, and serial console on Serial1. However, it does not power the target board. As always with Raspberry Pi, documentation is comprehensive and excellent. At USD12, it is an excellent choice. |
Using a Raspberry Pi 4B
|
I haven't tested this solution.
|
Using a standard programmer-debugger
|
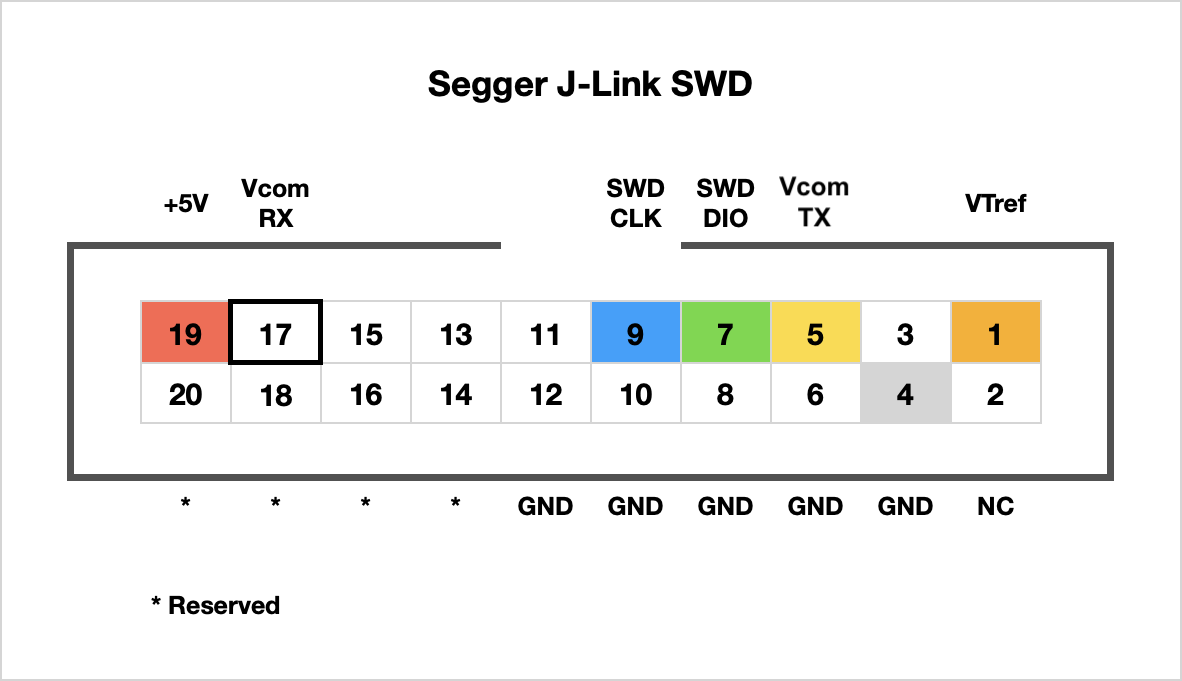
The standard tools include the openOCD server, the GDB client and a Segger J-Link programmer-debugger.
I faced various issues, but found fixes for all of them:
|
|
Links
|

|
|
Posted: 21 Apr 2022 Updated: 09 Feb 2024 |
