Debugging against the ESP32
Software
|
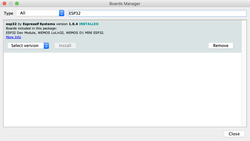
The ESP32 is supported with a dedicated boards package for the Arduino IDE. Installing the Arduino core for the ESP32 goes through the usual procedure with the Boards Manager.
Espressif maintains the repository and provides all the relevant documentation. Dedicated libraries support the main features, like WiFi, Bluetooth, clock, ... |
Using the board
|
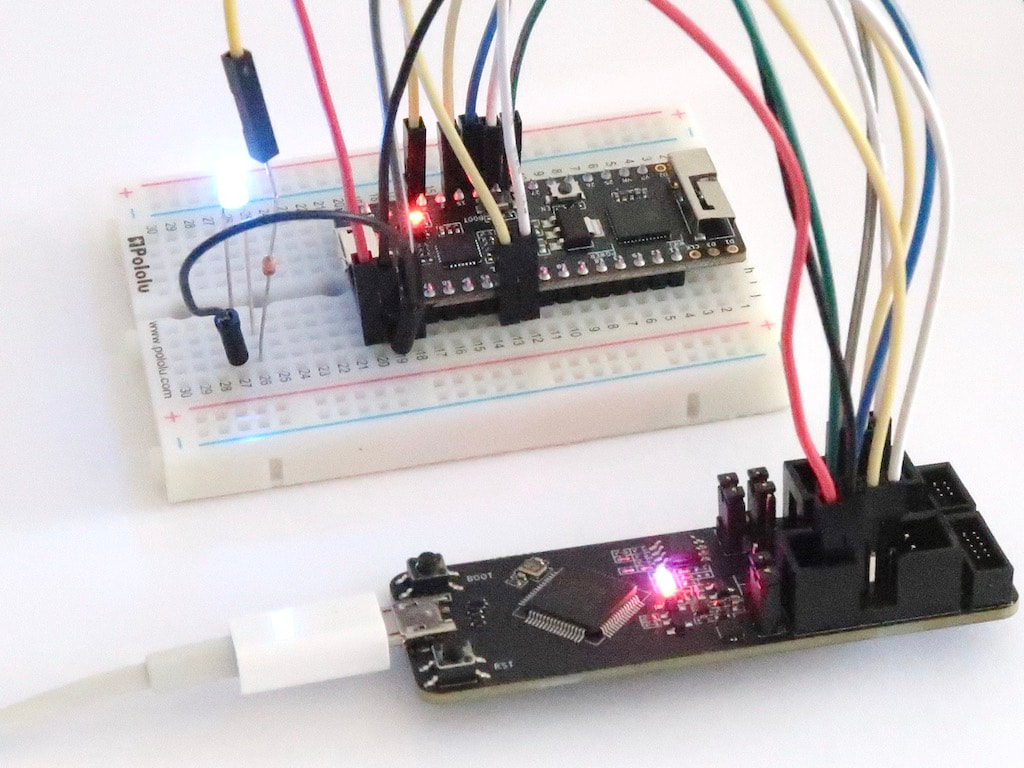
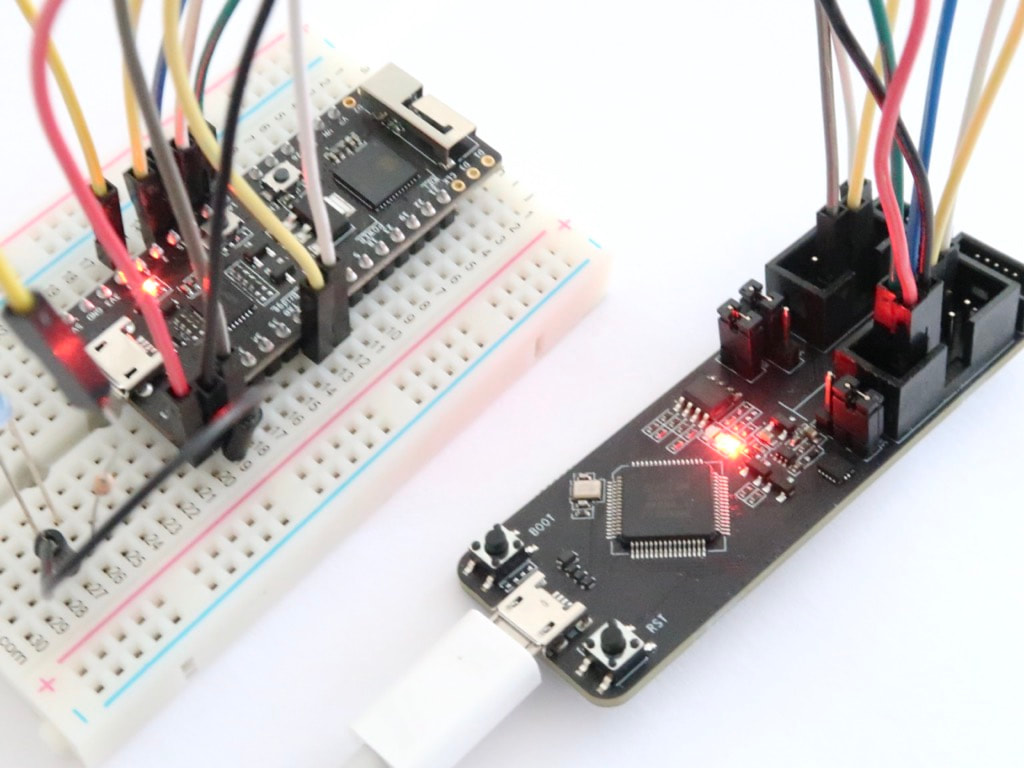
The whole installation includes an ESP32 Pico v4.1 board connected to the ESP-Prog programmer-debugger.
I faced an unexpected issue with the ESP32 Pico v4.1 board. Only two GPIOs could blink the LED, GPIO4 and GPIO12 (#3662). |
Debugging with ESP-Prog
|
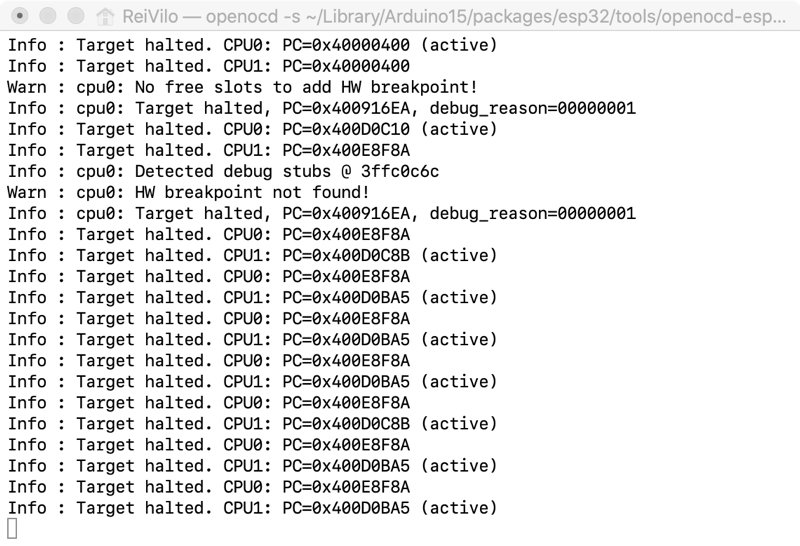
The ESP-Prog provides JTAG debugging and re-routes the serial console. It requires a specific version of OpenOCD, OpenOCD-ESP32. By chance, binaries are available for the main OSes.
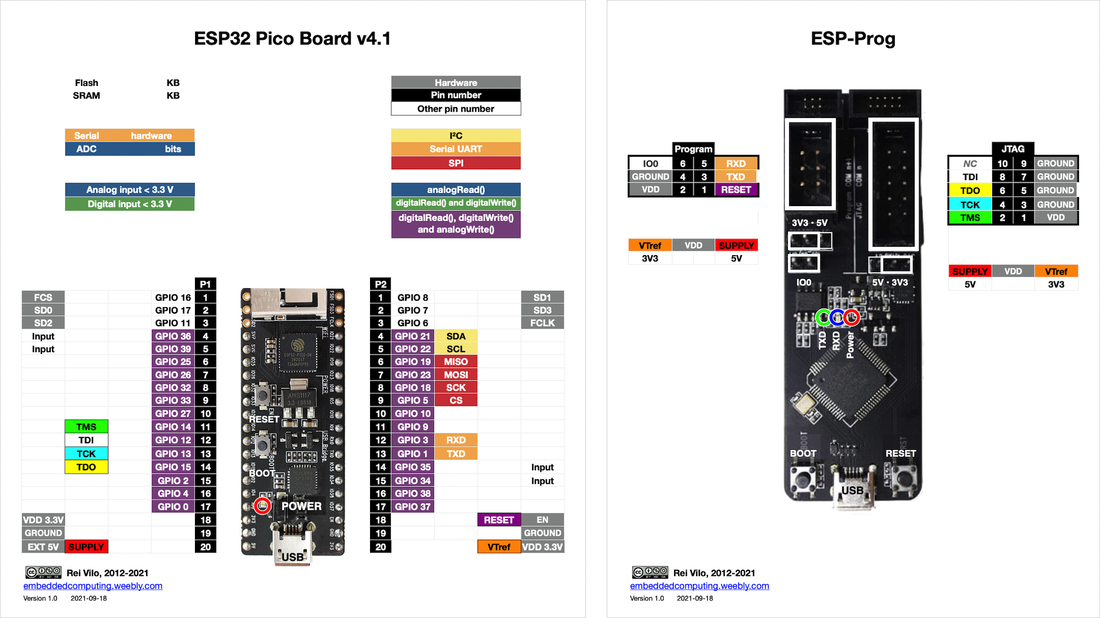
Here's the cabling for JTAG debugging. |
|
Espressif details the procedures for the different operating systems at Establish Serial Connection with ESP32.
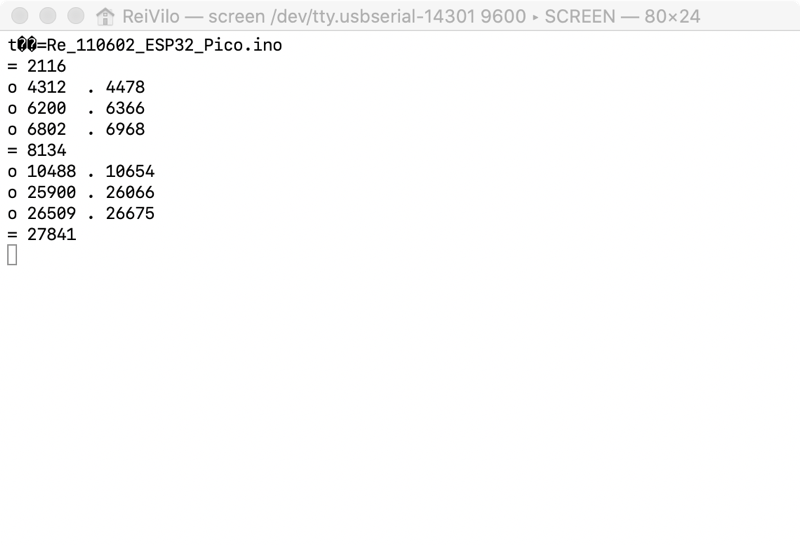
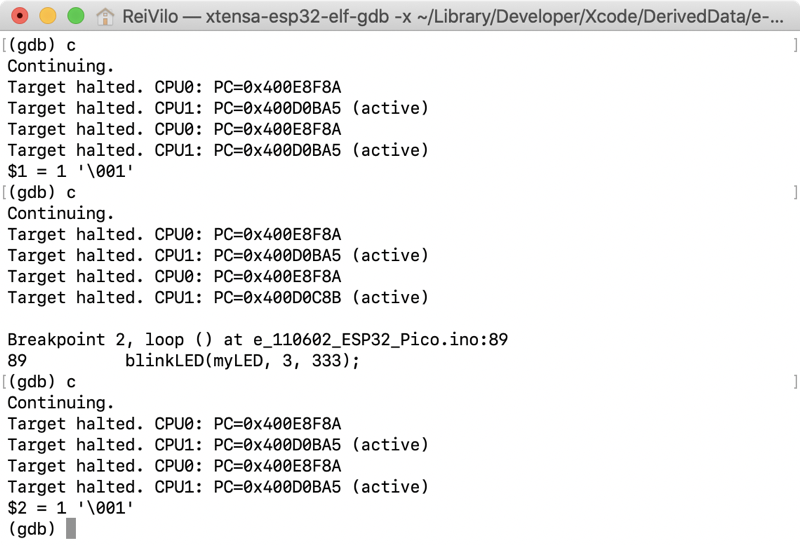
Below, the debugging session launched from Xcode includes three windows, from left to right: the serial console, the GDB server, the GDB client. |
Conclusion
|
The boards based on the ESP32 provide a really affordable introduction to IoT. Compared to the ESP8266, Espressif has done a tremendous job in improving the documentation.
The ESP-Prog programmer-debugger provides an affordable way to debug against the ESP32. However, when adding the programmer-debugger to the board, the grand total, albeit remaining competitive, is comparable to other solutions from competitors. |
Pros
|
Cons
|
Wrap-Up
|
Links
Posted: 23 Jan 2020
Updated: 18 Oct 2021

