Graphics: Histogram
|
The new gHistogram is a class and contains, apart from the constructor, two functions: dDefine and draw.
It displays:
|
dDefine
|
void dDefine defines an histogram graphic with the following parameters:
Required parameters
Right, the histogram with default parameters |
|
|
Optional parameters with default values
|
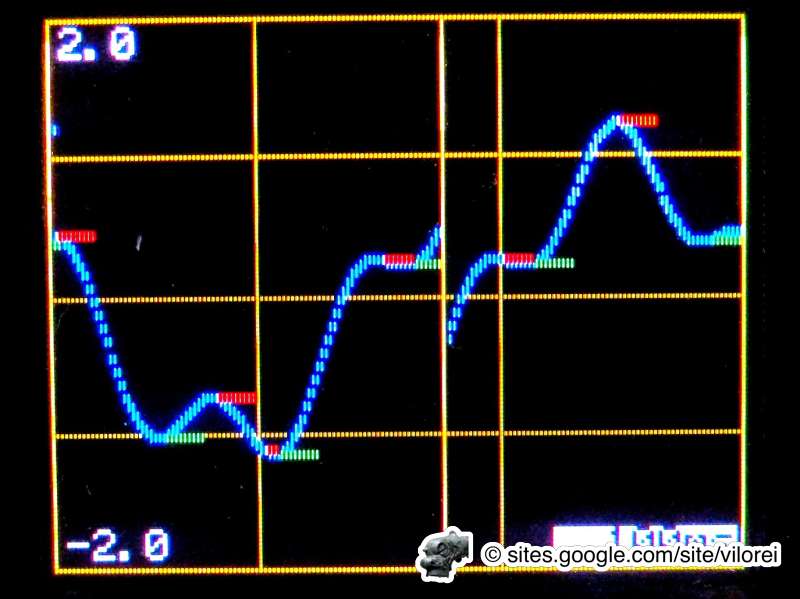
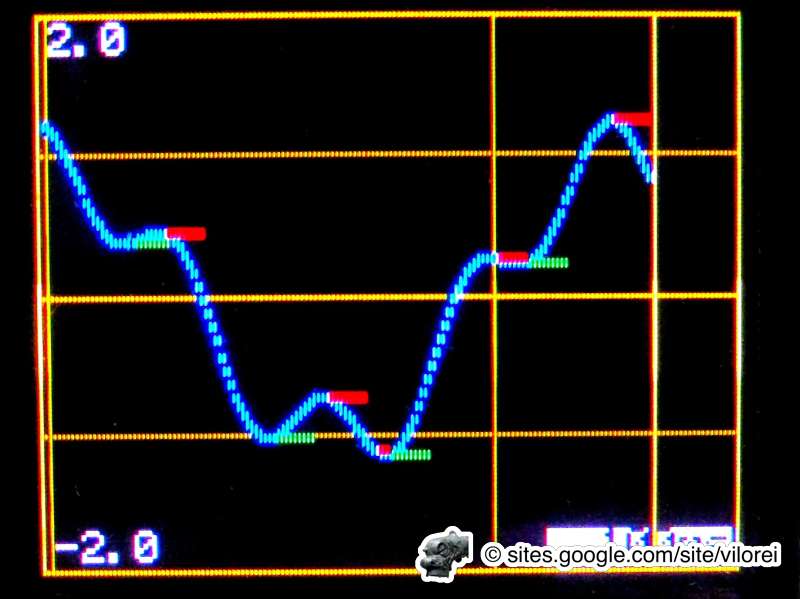
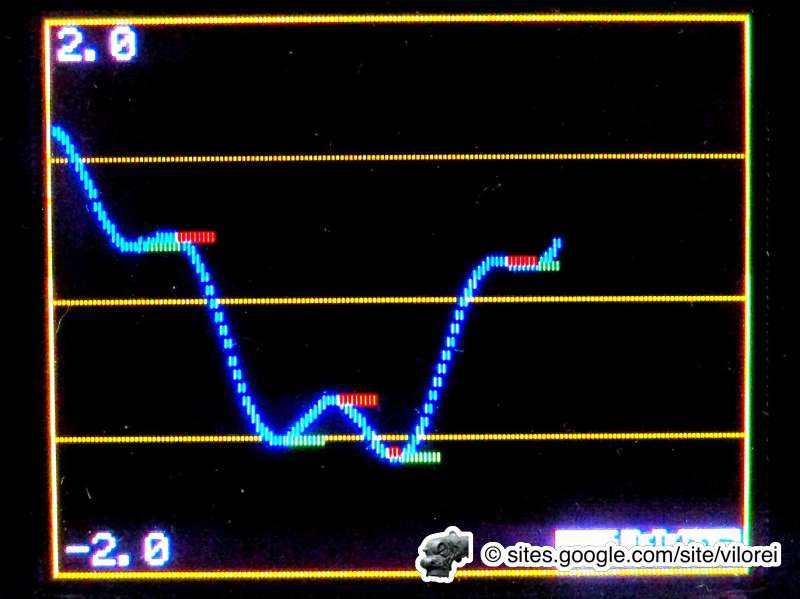
- uint16_t memory=8, keeps max and min memory for 8 periods. 0 means no memory.
Left: with memory set to 8 (default)
|
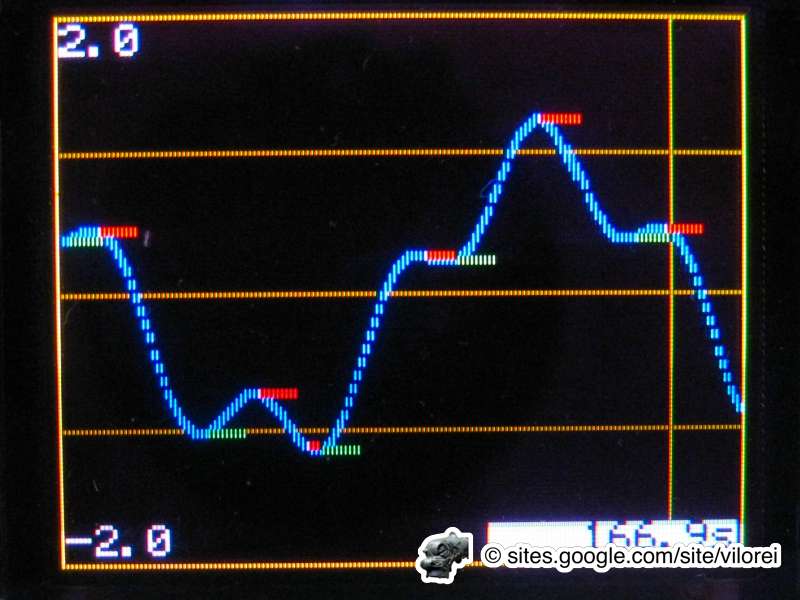
Right: with no memory
|
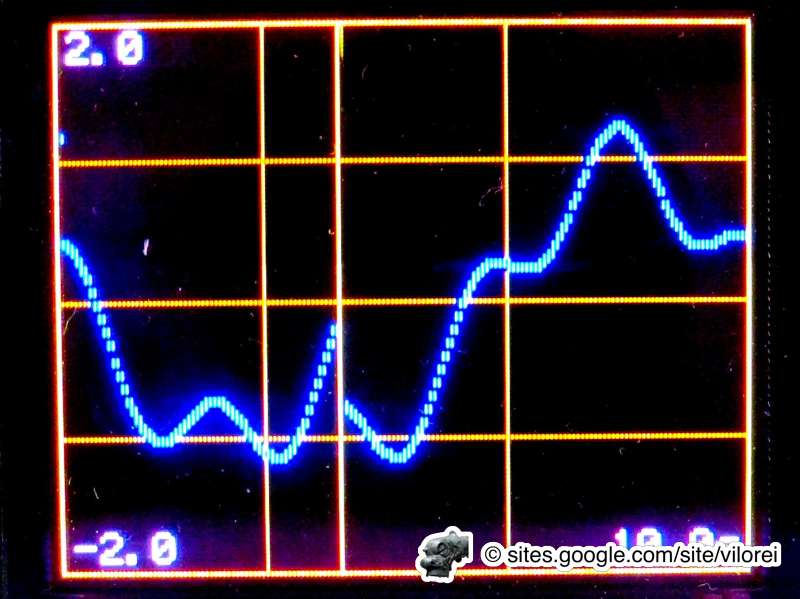
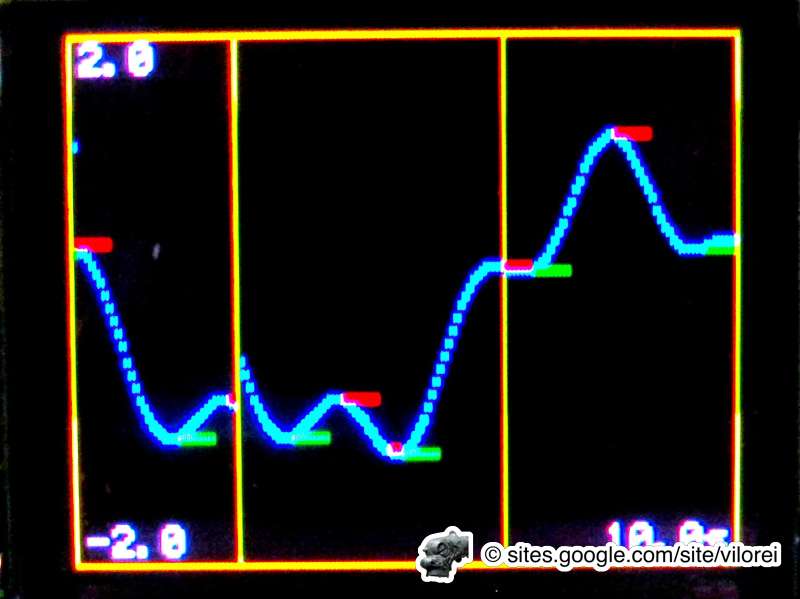
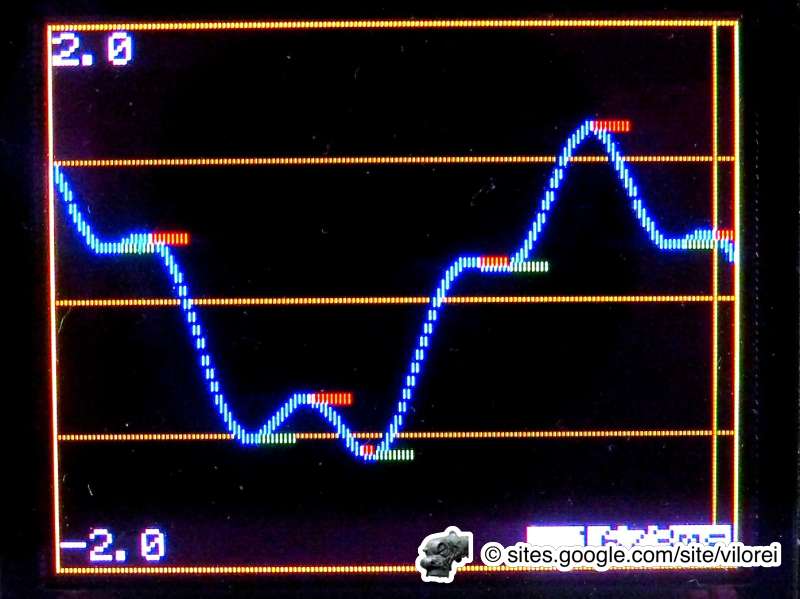
- uint16_t gridX=4, divides the value axis into 4 areas with 4-1=3 lines. 0 means no grid.

Left: with grid for values set to 4 (default)
|
Right: with no grid for values
|
- uint16_t gridY=0, shows a vertical bar on the time axis every specified number measures. 0 means no grid.

Left: with grid for time set to 100 (default)
|
Right: with no grid for time
|
- boolean continous=false, manages the way new values are displayed when the right-most part of the graphic is reached.

Left: If false (default), new measure starts over from the left-most side. A bright yellow bar makes the frontier.
|
Right: If true, previous measures are moved to the left and the new measure is shown on the right.
|
|
Draw
|
void draw(float value); updates the graphic with value.
When lapse is set to 0 (default), all values are displayed and there's no control of the period. When lapse is defined (>0), the period of time between two consecutive measures is monitored:
|
|
