Gauge
|
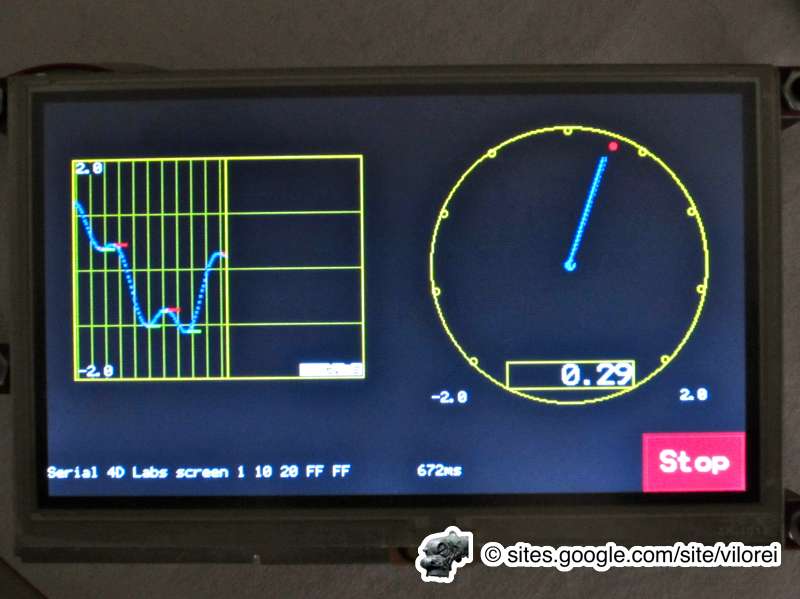
The gauge graphic displays one value on a circular dial.
The gGauge is a class and contains, apart from the constructor, two functions: dDefine and draw. Temporary minimum and maximum values are noticed with a green and red dot. On the same screen, an histogram and a gauge display Parameters are very close to those of Histogram. |
|
dDefine
|
void dDefine( defines an histogram graphic with the following parameters:
Required parameters Serial_LCD * lcd0, LCD to which the button belongs, with &myLCD, uint16_t x0, uint16_t y0, point x0, y0, uint16_t dx, uint16_t dy, x-width dx and y-height dy, float valueMin, float valueMax, minimal and maximal values. Optional parameters with default values uint16_t memory=8, keeps max and min memory for 8 periods. 0 means no memory. uint16_t grid=8, divides the value axis into 8 areas with 8+1=3 dots. 0 means no grid. uint16_t backColour=blackColour, self-contained uint16_t frontColour=whiteColour, uint16_t gridColour=yellowColour, uint16_t valueColour=blueColour, uint16_t minColour=greenColour, uint16_t maxColour=redColour); |
draw
|
void draw(float value, String sValue=""); updates the graphic with value and displays sValue if provided.
|
